 ECharts圖表
# Smart之EChart圖表
# 1. 說明
範例通過ECharts,來實現圖表數據資訊的展示。ECharts是一個使用 JavaScript 實現的開源視覺化庫,可提供直觀,互動豐富,可高度個性化定製的數據視覺化圖表。詳情可點選Echarts網站 (opens new window)進行了解。
通過範例學習,可以學習在Smart中引入ECharts進行圖表展示。
# 2. 設計明細
開啟Smart智慧控制平臺,分別加入下插圖之控制元件。或者通過點選功能表欄[檔案]-[打開專案]選擇專案打開該範例。
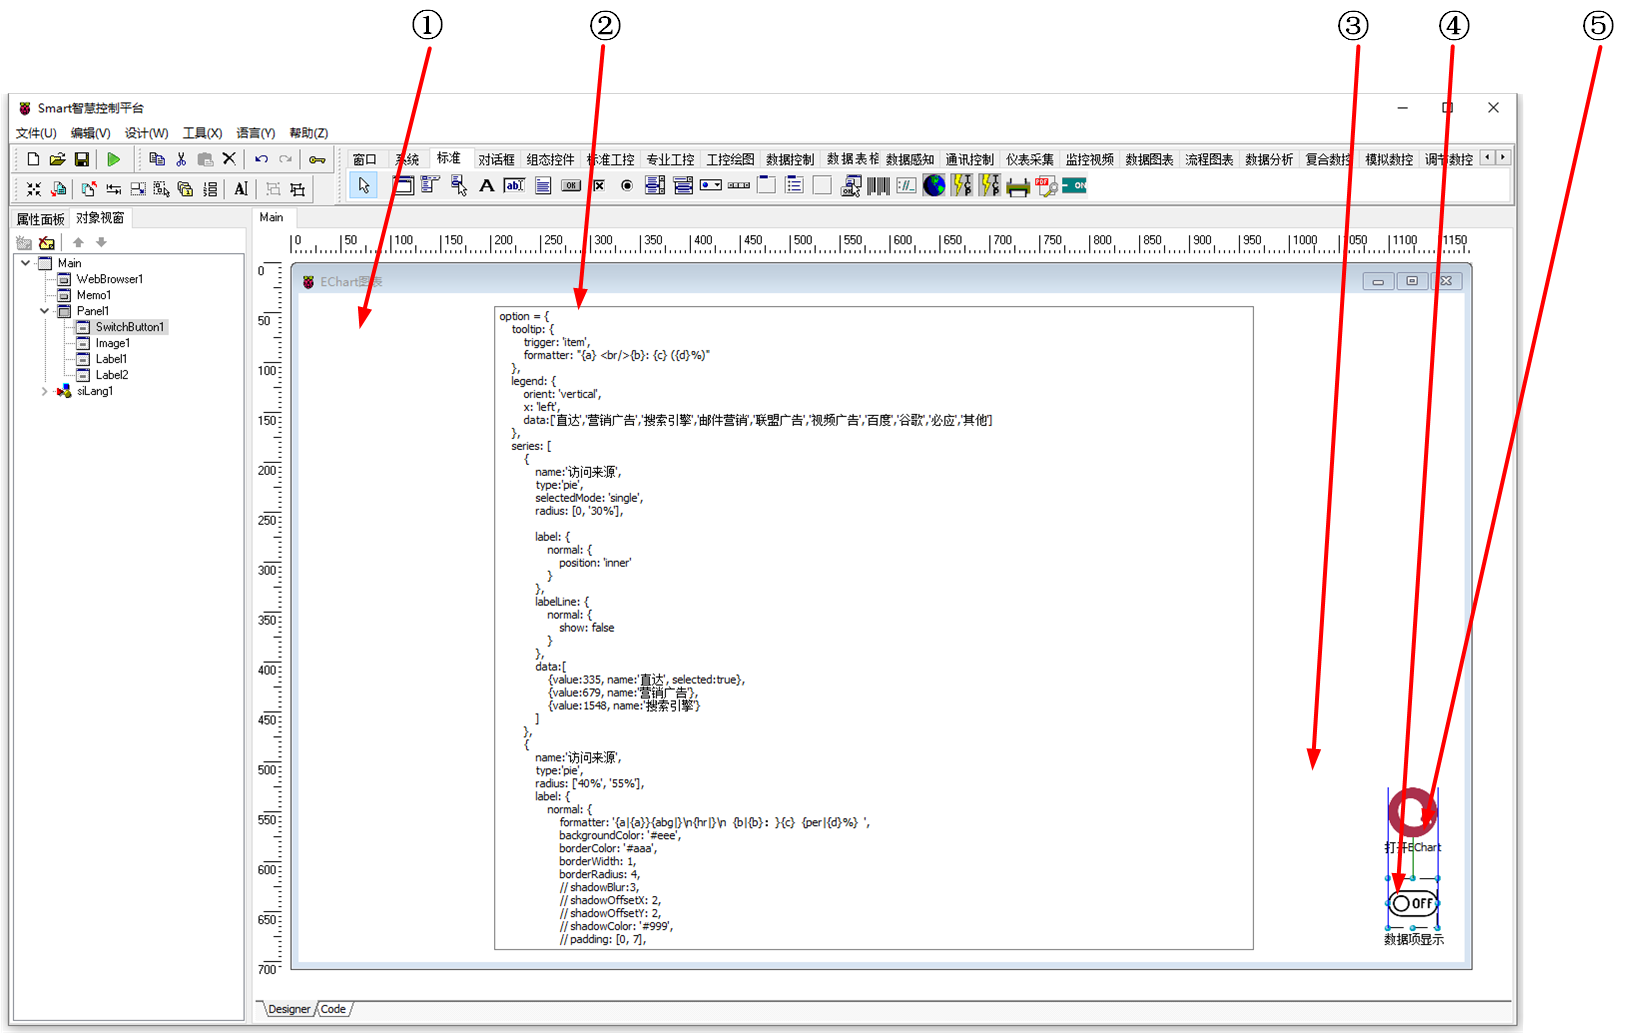
①:TWebBrowser元件,控制元件名稱為WebBrowser1。
②:TMemo元件,控制元件名稱為Memo1。
③:TPanel元件,控制元件名稱為Panel1。
④:TSwitchButton元件,控制元件名稱為SwitchButton1。
⑤:TImage元件,控制元件名稱為Image1。
Main窗體屬性設定
Caption:設定窗體標題=EChart圖表。ClientHeight:設定窗體客戶區高度=670。ClientWidth:設定窗體客戶區寬度=1168。
①WebBrowser1屬性設定
Align:設定控制元件對齊=True。
②Memo1屬性設定
Height:設定控制元件高度=645。Width:設定控制元件寬度=761。Visible:設定控制元件是否可見=False。Lines:設定文字內容。點選右側的[...]或者雙擊該屬性打開編輯器,輸入如下內容。
option = {
    tooltip: {
        trigger: 'item',
        formatter: "{a} <br/>{b}: {c} ({d}%)"
    },
    legend: {
        orient: 'vertical',
        x: 'left',
        data:['直達','營銷廣告','搜索引擎','郵件營銷','聯盟廣告','視訊廣告','百度','谷歌','必應','其他']
    },
    series: [
        {
            name:'訪問來源',
            type:'pie',
            selectedMode: 'single',
            radius: [0, '30%'],

            label: {
                normal: {
                    position: 'inner'
                }
            },
            labelLine: {
                normal: {
                    show: false
                }
            },
            data:[
                {value:335, name:'直達', selected:true},
                {value:679, name:'營銷廣告'},
                {value:1548, name:'搜索引擎'}
            ]
        },
        {
            name:'訪問來源',
            type:'pie',
            radius: ['40%', '55%'],
            label: {
                normal: {
                    formatter: '{a|{a}}{abg|}\n{hr|}\n  {b|{b}:}{c}  {per|{d}%}  ',
                    backgroundColor: '#eee',
                    borderColor: '#aaa',
                    borderWidth: 1,
                    borderRadius: 4
                    rich: {
                        a: {
                            color: '#999',
                            lineHeight: 22,
                            align: 'center'
                        },
                        hr: {
                            borderColor: '#aaa',
                            width: '100%',
                            borderWidth: 0.5,
                            height: 0
                        },
                        b: {
                            fontSize: 16,
                            lineHeight: 33
                        },
                        per: {
                            color: '#eee',
                            backgroundColor: '#334455',
                            padding: [2, 4],
                            borderRadius: 2
                        }
                    }
                }
            },
            data:[
                {value:335, name:'直達'},
                {value:310, name:'郵件營銷'},
                {value:234, name:'聯盟廣告'},
                {value:135, name:'視訊廣告'},
                {value:1048, name:'百度'},
                {value:251, name:'谷歌'},
                {value:147, name:'必應'},
                {value:102, name:'其他'}
            ]
        }
    ]
};
1
2
3
4
5
6
7
8
9
10
11
12
13
14
15
16
17
18
19
20
21
22
23
24
25
26
27
28
29
30
31
32
33
34
35
36
37
38
39
40
41
42
43
44
45
46
47
48
49
50
51
52
53
54
55
56
57
58
59
60
61
62
63
64
65
66
67
68
69
70
71
72
73
74
75
76
77
78
79
80
81
82
2
3
4
5
6
7
8
9
10
11
12
13
14
15
16
17
18
19
20
21
22
23
24
25
26
27
28
29
30
31
32
33
34
35
36
37
38
39
40
41
42
43
44
45
46
47
48
49
50
51
52
53
54
55
56
57
58
59
60
61
62
63
64
65
66
67
68
69
70
71
72
73
74
75
76
77
78
79
80
81
82
③Panel1屬性設定
Caption:設定面板顯示的內容,此處需清空預設內容。Height:設定控制元件高度=222。Width:設定控制元件寬度=185。Color:設定顏色顯示的顏色=clWindow。
④SwitchButton1屬性設定
Height:設定控制元件高度=50。Width:設定控制元件寬度=50。
⑤Image1屬性設定
Height:設定控制元件高度=50。Width:設定控制元件寬度=50。Stretch:設定圖片拉伸=True。Picture:設定圖片。點選Picture屬性右側的[...]按鈕,打開檔案上傳界面,點選[Load...]從檔案瀏覽器中選擇對應的圖片檔案上傳,返回該界面下,待顯示出圖片後點擊[OK]載入圖片。

# 3. 程式設計
# 3.1. 程式初始設定
該程式無初始設定。
# 3.2. 事件設定
- ④SwitchButton1-OnSwitch事件
當開啟或者關閉該按鈕時,對應的用於構造圖表的設定內容文字框會顯示或者關閉。
procedure TMyHandler.SwitchButton1Switch;
// 開啟、關閉配置資訊
begin
  FThis.Memo1.Visible := FThis.SwitchButton1.IsChecked;
end;
1
2
3
4
5
2
3
4
5
- ⑤Image1-OnClick事件
當點選該按鈕時,顯示圖表。
procedure TMyHandler.Image1Click;
var
 Str:TStringlist;
 strSPMC,strSL,PathStr:string;
Begin
   Str := TStringlist.Create;
       strSPMC := '1,';
        strSL :=  '6,';
   try
    //str.add('< html> ');
    str.add('<html> ');
    str.add('<head> ');
    str.add('    <meta http-equiv="content-type" content="text/html";charset="utf-8"> ');
    //str.add('    <title>ECharts</title> ');
   // str.add('    <-- 引入 echarts.js --> ');
    str.add('    <script src="https://cdnjs.cloudflare.com/ajax/libs/echarts/4.1.0/echarts.min.js"></script> ');
    str.add('</head> ');
    str.add('<body> ');
    //str.add('    <-- 為ECharts準備一個具備大小(寬高)的Dom --> ');
    str.add('    <div id="main" style="width: 1100px;height:600px;"></div> ');
    str.add('    <script type="text/javascript"> ');
    //str.add('        // 基於準備好的dom,初始化echarts實體 ');
    str.add('        var myChart = echarts.init(document.getElementById(''main'')); ');
    str.add(' ');
    str.add('        // 指定圖表的配置項和數據 ');
    str.Add(FThis.Memo1.Lines.Text);
    //str.add('        var option = { ');
    //str.add('            title: { ');
    //str.add('                text: ''類別銷售對比''');
    //str.add('            }, ');
    //str.add('            tooltip: {}, ');
    //str.add('            legend: { ');
    //str.add('                data:[''銷量'']');
    //str.add('            }, ');
    //str.add('            xAxis: { ');
    //str.add('                data: [' + strSPMC + '] ');
    //str.add('            }, ');
    //str.add('            yAxis: {}, ');
    //str.add('            series: [{ ');
    //str.add('                name: ''品類'', ');
    //str.add('                type: ''bar'', ');
    //str.add('                data: [' + strSL + '] ');
    //str.add('            }] ');
    //str.add('        }; ');
    str.add(' ');
    str.add('        // 使用剛指定的配置項和數據顯示圖表。 ');

    str.add('        myChart.setOption(option); ');
    str.add('    </script> ');
    str.add('</body> ');
    str.add('</html>');
  //產生並儲存網頁
    PathStr := '\index.html';
    str.SaveToFile(PathStr);
  //載入本地網頁
    FThis.WebBrowser1.Navigate(PathStr);
   Finally
   //Except {ErrorMsg / RaiseMsg(Const Error:String)}
     Str.Free;
   End;
End;
1
2
3
4
5
6
7
8
9
10
11
12
13
14
15
16
17
18
19
20
21
22
23
24
25
26
27
28
29
30
31
32
33
34
35
36
37
38
39
40
41
42
43
44
45
46
47
48
49
50
51
52
53
54
55
56
57
58
59
60
61
2
3
4
5
6
7
8
9
10
11
12
13
14
15
16
17
18
19
20
21
22
23
24
25
26
27
28
29
30
31
32
33
34
35
36
37
38
39
40
41
42
43
44
45
46
47
48
49
50
51
52
53
54
55
56
57
58
59
60
61
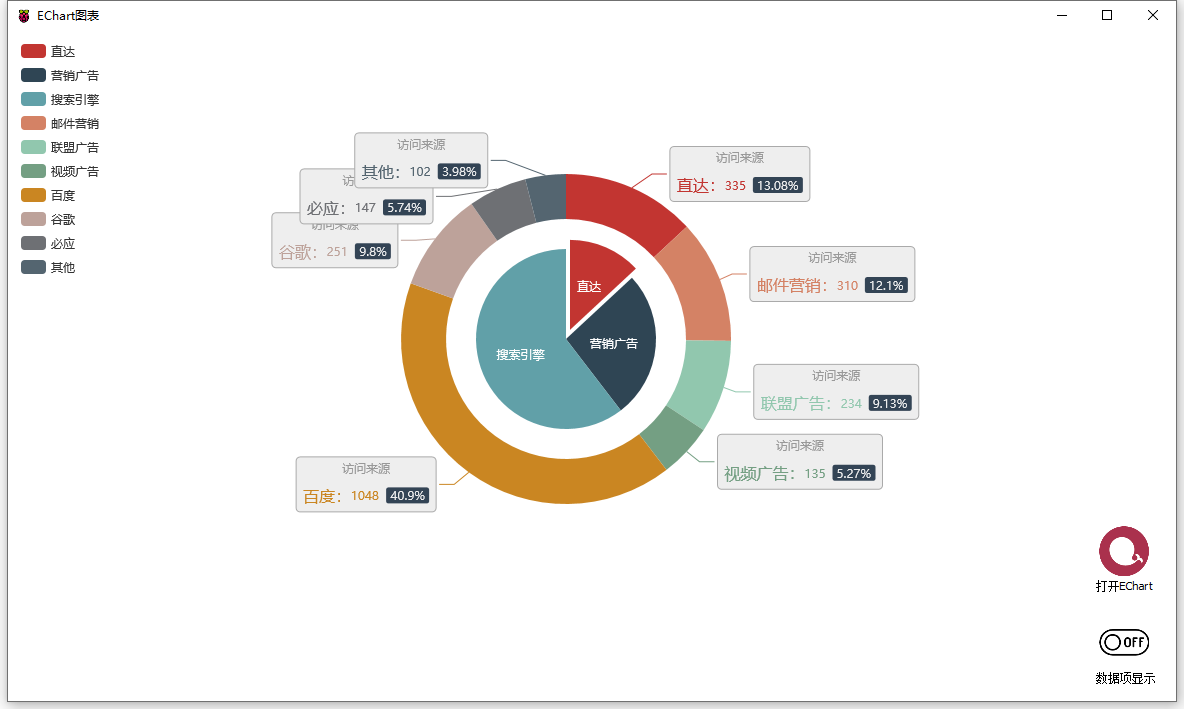
# 4. 運行結果
通過工具欄儲存,將程式儲存為 sdb 專案檔案。
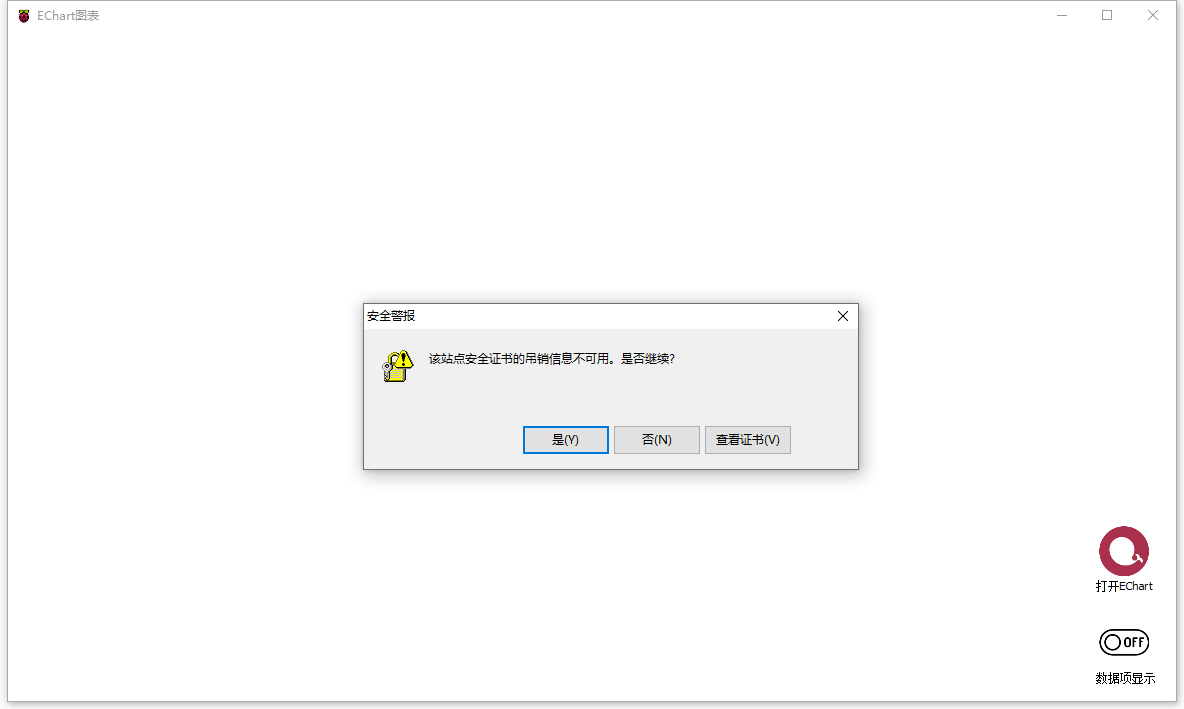
使用滑鼠點選工具欄運行(Run),測試運行結果。點選右下角的ECharts圖示,初次啟動可能需要等待一段時間,部分設備在該階段的運行過程中可能會彈出安全警報提示,在該界面下點選[是(Y)]按鈕,打開圖表,點選右下角的開關按鈕,可開啟或者關閉配置文字框的顯示。