
 互動-SVG-HMI元件
# FastWeb 互動-SVG-HMI元件
infographiqJS是實現資訊化圖表展示功能的JavaScript核心元件庫。通過核心元件庫,可以將SVG圖表與各數據表格及其他數據展示方案結合在一起,實現互動化數據互動的效果。
# 1. 下載示例
點選https://github.com/marinebon/infographiqJS/blob/main/infographiq_example.zip (opens new window)下載關聯的示例,將其解壓至FastWeb目錄下library/js/infographiq中。
# 2. 確認參數
使用文字編輯器打開示例中的html文件。顯示的內容如下:
<!DOCTYPE HTML>
<html>
	<head>
    <title>Template Infographic</title>
    <meta charset="utf-8" />
		<meta name="viewport" content="width=device-width, initial-scale=1" />

    <!-- load required css and javascript libraries used by infographiq functionality -->
    <script src="https://code.jquery.com/jquery-3.6.0.min.js"
      integrity="sha256-/xUj+3OJU5yExlq6GSYGSHk7tPXikynS7ogEvDej/m4="
      crossorigin="anonymous"></script>
    <script src="https://stackpath.bootstrapcdn.com/bootstrap/3.4.1/js/bootstrap.min.js"
      integrity="sha384-aJ21OjlMXNL5UyIl/XNwTMqvzeRMZH2w8c5cRVpzpU8Y5bApTppSuUkhZXN0VxHd"
      crossorigin="anonymous"></script>
    <script src="https://d3js.org/d3.v5.min.js"></script>
    <link rel="stylesheet" href="https://stackpath.bootstrapcdn.com/bootstrap/3.4.1/css/bootstrap.min.css"
      integrity="sha384-HSMxcRTRxnN+Bdg0JdbxYKrThecOKuH5zCYotlSAcp1+c8xmyTe9GYg1l9a69psu"
      crossorigin="anonymous">
    <link rel="stylesheet" href="https://cdnjs.cloudflare.com/ajax/libs/font-awesome/4.7.0/css/font-awesome.css"
      integrity="sha512-5A8nwdMOWrSz20fDsjczgUidUBR8liPYU+WymTZP1lmY9G6Oc7HlZv156XqnsgNUzTyMefFTcsFH/tnJE/+xBg=="
      crossorigin="anonymous" />
	</head>
	<body>
    <!-- define bootstrap layout that will contain the infographic -->
    <div class="container-fluid">
      <div class="row">
        <div class="col-md-9">
          <div id = "svg1"></div>
        </div>
        <div class="col-md-3">
          <ul id="toc1"></ul>
        </div>
      </div>
    </div>

  <!-- run infographiq function to link the svg with the svg_list -->
  <script src='https://marinebon.org/infographiqJS/libs/infographiq_latest/infographiq.js'></script>
  <link rel="stylesheet" href="https://marinebon.org/infographiqJS/libs/infographiq_latest/infographiq.css">
  <script>
    link_svg({
      svg: "illustrator_example.svg",
      csv: "icon_link.csv",
      svg_id: "svg1",
      toc_id: "toc1",
      toc_style: "accordion",
      text_toggle: "toggle_off",
      svg_filter: "illustrator_example.svg"});
  </script>
</body>
</html>
2
3
4
5
6
7
8
9
10
11
12
13
14
15
16
17
18
19
20
21
22
23
24
25
26
27
28
29
30
31
32
33
34
35
36
37
38
39
40
41
42
43
44
45
46
47
48
49
50
通過閱讀,我們可以找到目前的網頁文件通過呼叫同目錄下的svg與csv檔案來實現相關的效果,故此處我們可以將svg,csv,svg_filter三處位置分別設定參數為param_svg,param_csv,param_filter。
# 3. 修改模板
# 3.1. 本地化處理
從上述內容中可以看到示例html文件使用了較多的外部鏈接,我們要將這些外部鏈接引用的內容下載下來進行本地化處理。
根據上述文件整理出以下需要下載的檔案:
https://code.jquery.com/jquery-3.6.0.min.js
https://stackpath.bootstrapcdn.com/bootstrap/3.4.1/js/bootstrap.min.js
https://d3js.org/d3.v5.min.js
https://stackpath.bootstrapcdn.com/bootstrap/3.4.1/css/bootstrap.min.css
https://marinebon.org/infographiqJS/libs/infographiq_latest/infographiq.js
https://marinebon.org/infographiqJS/libs/infographiq_latest/infographiq.css
2
3
4
5
6
由於font-aweson還需要鏈接其他外部庫,此處請點選https://codeload.github.com/FortAwesome/Font-Awesome/zip/refs/tags/v4.7.0 (opens new window)下載字型檔,並將其中的除font-aweson.css外的檔案解壓至library/js/infographiq/fonts目錄下。
將上述庫檔案地址都修改爲本地地址,最終修改完顯示如下:
<!DOCTYPE HTML>
<html>
	<head>
    <title>Template Infographic</title>
    <meta charset="utf-8" />
		<meta name="viewport" content="width=device-width, initial-scale=1" />

    <!-- load required css and javascript libraries used by infographiq functionality -->
    <script src="library/js/infographiq/jquery-3.6.0.min.js"
      integrity="sha256-/xUj+3OJU5yExlq6GSYGSHk7tPXikynS7ogEvDej/m4="
      crossorigin="anonymous"></script>
    <script src="library/js/infographiq/bootstrap.min.js"
      integrity="sha384-aJ21OjlMXNL5UyIl/XNwTMqvzeRMZH2w8c5cRVpzpU8Y5bApTppSuUkhZXN0VxHd"
      crossorigin="anonymous"></script>
    <script src="library/js/infographiq/d3.v5.min.js"></script>
    <link rel="stylesheet" href="library/js/infographiq/bootstrap.min.css"
      integrity="sha384-HSMxcRTRxnN+Bdg0JdbxYKrThecOKuH5zCYotlSAcp1+c8xmyTe9GYg1l9a69psu"
      crossorigin="anonymous">
    <link rel="stylesheet" href="library/js/infographiq/font-awesome.css"
      integrity="sha512-5A8nwdMOWrSz20fDsjczgUidUBR8liPYU+WymTZP1lmY9G6Oc7HlZv156XqnsgNUzTyMefFTcsFH/tnJE/+xBg=="
      crossorigin="anonymous" />
	</head>
	<body>
    <!-- define bootstrap layout that will contain the infographic -->
    <div class="container-fluid">
      <div class="row">
        <div class="col-md-9">
          <div id = "svg1"></div>
        </div>
        <div class="col-md-3">
          <ul id="toc1"></ul>
        </div>
      </div>
    </div>

  <!-- run infographiq function to link the svg with the svg_list -->
  <script src='library/js/infographiq/infographiq.js'></script>
  <link rel="stylesheet" href="library/js/infographiq/infographiq.css">
  <script>
    link_svg({
      svg: "illustrator_example.svg",
      csv: "icon_link.csv",
      svg_id: "svg1",
      toc_id: "toc1",
      toc_style: "accordion",
      text_toggle: "toggle_off",
      svg_filter: "illustrator_example.svg"});
  </script>
</body>
</html>
2
3
4
5
6
7
8
9
10
11
12
13
14
15
16
17
18
19
20
21
22
23
24
25
26
27
28
29
30
31
32
33
34
35
36
37
38
39
40
41
42
43
44
45
46
47
48
49
50
修改font-aweson.css中的@font-face部分資訊,修改完成後顯示如下:
@font-face {
  font-family: 'FontAwesome';
  src: url('fonts/fontawesome-webfont.eot?v=4.7.0');
  src: url('fonts/fontawesome-webfont.eot?#iefix&v=4.7.0') format('embedded-opentype'), url('fonts/fontawesome-webfont.woff2?v=4.7.0') format('woff2'), url('fonts/fontawesome-webfont.woff?v=4.7.0') format('woff'), url('fonts/fontawesome-webfont.ttf?v=4.7.0') format('truetype'), url('fonts/fontawesome-webfont.svg?v=4.7.0#fontawesomeregular') format('svg');
  font-weight: normal;
  font-style: normal;
}
2
3
4
5
6
7
下載font儲存以上檔案。
# 3.2. 標記參數
根據預設,將param_svg,param_csv,param_filter分別設定于對應的參數位置中,設定完成後顯示如下:
<!DOCTYPE HTML>
<html>
	<head>
    <title>Template Infographic</title>
    <meta charset="utf-8" />
		<meta name="viewport" content="width=device-width, initial-scale=1" />

    <!-- load required css and javascript libraries used by infographiq functionality -->
    <script src="library/js/infographiq/jquery-3.6.0.min.js"
      integrity="sha256-/xUj+3OJU5yExlq6GSYGSHk7tPXikynS7ogEvDej/m4="
      crossorigin="anonymous"></script>
    <script src="library/js/infographiq/bootstrap.min.js"
      integrity="sha384-aJ21OjlMXNL5UyIl/XNwTMqvzeRMZH2w8c5cRVpzpU8Y5bApTppSuUkhZXN0VxHd"
      crossorigin="anonymous"></script>
    <script src="library/js/infographiq/d3.v5.min.js"></script>
    <link rel="stylesheet" href="library/js/infographiq/bootstrap.min.css"
      integrity="sha384-HSMxcRTRxnN+Bdg0JdbxYKrThecOKuH5zCYotlSAcp1+c8xmyTe9GYg1l9a69psu"
      crossorigin="anonymous">
    <link rel="stylesheet" href="library/js/infographiq/font-awesome.css"
      integrity="sha512-5A8nwdMOWrSz20fDsjczgUidUBR8liPYU+WymTZP1lmY9G6Oc7HlZv156XqnsgNUzTyMefFTcsFH/tnJE/+xBg=="
      crossorigin="anonymous" />
	</head>
	<body>
    <!-- define bootstrap layout that will contain the infographic -->
    <div class="container-fluid">
      <div class="row">
        <div class="col-md-9">
          <div id = "svg1"></div>
        </div>
        <div class="col-md-3">
          <ul id="toc1"></ul>
        </div>
      </div>
    </div>

  <!-- run infographiq function to link the svg with the svg_list -->
  <script src='library/js/infographiq/infographiq.js'></script>
  <link rel="stylesheet" href="library/js/infographiq/infographiq.css">
  <script>
    link_svg({
      svg: "param_svg",
      csv: "param_csv",
      svg_id: "svg1",
      toc_id: "toc1",
      toc_style: "accordion",
      text_toggle: "toggle_off",
      svg_filter: "param_filter"});
  </script>
</body>
</html>
2
3
4
5
6
7
8
9
10
11
12
13
14
15
16
17
18
19
20
21
22
23
24
25
26
27
28
29
30
31
32
33
34
35
36
37
38
39
40
41
42
43
44
45
46
47
48
49
50
至此,模板內容已設定完成,可進入JQueryFrame元件管理界面,將上述內容填寫入模板中。
# 3.3. 設定參數
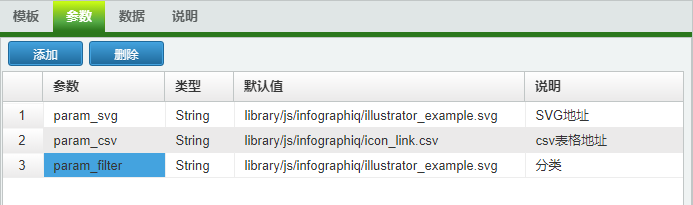
在參數界面中,設定上述參數,分別為其設定預設值:
# 3.4. 與資料庫欄位聯動
此示例無需與資料庫欄位聯動。此部分請留空設定。
# 4. 設定檔案
根據上述方式與預設的設定已經可以匯入至TUgJQueryFrame中檢視演示。如果需要自定義csv與svg等檔案,我們可以按照下述方式進行設定。
# 4.1. 建立SVG檔案的要求
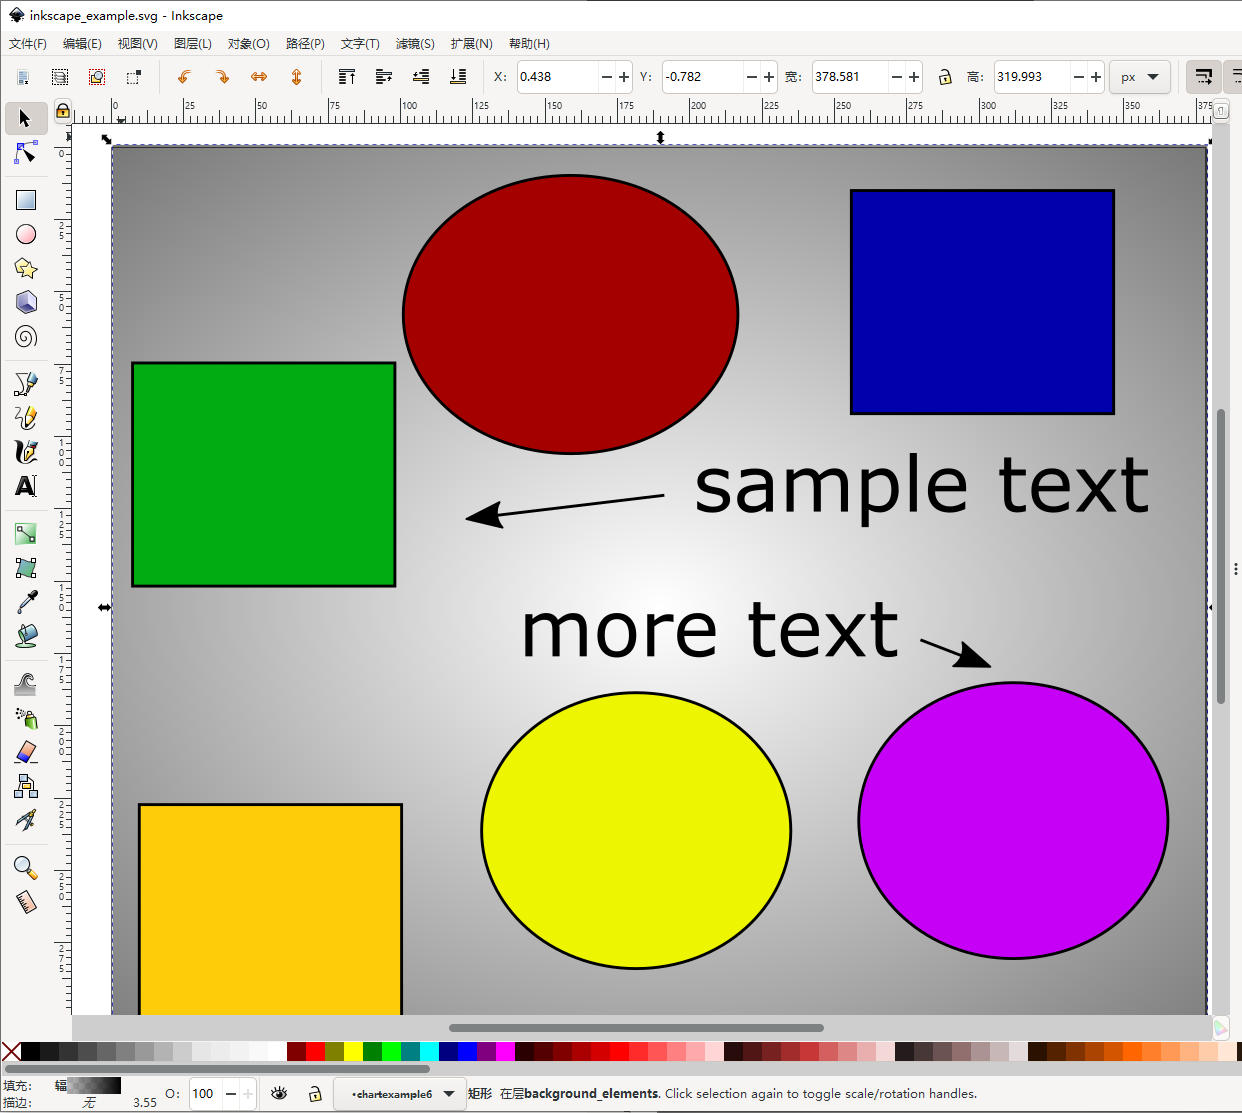
可以使用Adobe Illustrator、Inkspace(免費)等程式來編輯或檢視向量圖形檔案。下面以Inkspace為例介紹如何進行設定。
我們可以使用Inkspace打開infographiq中的示例檔案inkscape_example.svg
點選[圖層]-[圖層],打開圖層界面,可以看到以下內容:

以上是在infographiq中使用的SVG影象所需要的圖層結構。
# 4.1.1. 文字圖層(text)
此圖層用於在SVG中顯示相關附加的文字或圖形資訊,可選是否需要此圖層,如果需要此圖層的,則其圖層名稱必須為小寫的text。其中的元素必須是基於向量的。
# 4.1.2. 圖示圖層(icons)
此圖層是必須存在的,圖示圖層包含了所有可以點選的元素。此圖層的名稱可以命名為除text與點選的元素對象的名稱外的其他任意名稱,以示例的圖層為例,點選icons圖層左側的三角形,可以看到其包含了六個子圖層,這些子圖層中每個均定義了可以點選的元件。
- 這些子圖層的名稱不應包含空格、逗號或者
text。 - 子圖層中的所有元素均應基於向量而不是基於光柵。
- 沒有其他元素重疊于要點選的元件的上層。
- 每個子層都包含單個可點選圖示的所有元素。
# 4.1.3. 背景層(background_elements)
背景層是一個可選層,包含了影象的所有非響應元素,這個層的名稱也可以是任何除了text或者可點選元素的名稱。
# 4.1.4. 編輯圖層XML
爲了使svg影象可以在infographiq中正常運行,需要在Inkspace中設定面板[圖層]-[圖層]與[編輯]-[XML編輯器]。
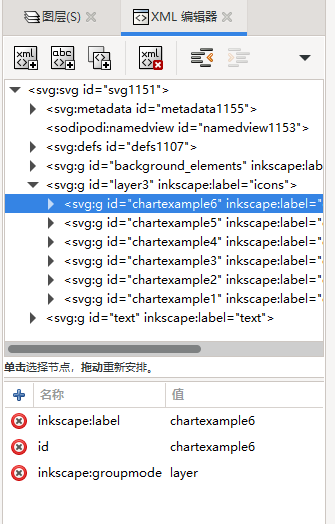
對於每一個圖層,請按照以下方式設定:
- 單擊 XML 編輯器中的圖層的關聯條目。
- 修改圖層的id以匹配圖層的名稱。
- 在XML編輯器中選擇
text圖層,在下側的框中,選擇display: inline左側紅色的×以刪除此行(在示例檔案inkscape_example.svg中,display:inline這一行已經被刪除了。)
# 4.2. 鏈接表(CSV)
# 4.2.1. 表結構
鏈接的表格通常包含以下要求:
- 表格的第一行必須是列標題。
- 該表必須是以
.csv格式儲存,其中的值以逗號,進行分隔。 - 列的順序無關緊要,可隨意進行排序。
- 每行的內容分別代表SVG中一個可點選的圖示元素。
- 列中唯一需要的是
icon,用於指定鏈接的圖示元素,其他的列均為可選項。
# 4.2.2. 表格列中的欄位說明
- icon(必須):影象中要被點選的圖層的名稱,名稱必須是完全匹配的,在本節的示例中,使用到的名稱分別是:
chartexample1chartexample2chartexample3chartexample4chartexample5chartexample6
以上分別對應為每個圖層的id與名稱。

svg(可選):用於表示所對應的svg檔名稱。
title(可選):當滑鼠懸停在可點選的元素上時顯示在影象上的文字。如果沒有此列,則
icon欄中給出的名稱將會顯示在影象上。請將標題設定儘量少的字數,因為過長的標題會導致顯示出現不可預料的問題。section(可選):一種按類別分隔可點選元素的方法。
not_mordal(可選):一種直接鏈接到外部 HTML 資源的方法,而不是將其作為模式視窗載入到影象上方。此列中允許使用兩個值:
- T:直接鏈接到外部 HTML 資源,基於
link列(不是模式視窗)中的值。 - F:外部 HTML 檔案在 Infographiq影象上方打開,基於
link列(模式視窗)中的值。
- T:直接鏈接到外部 HTML 資源,基於