
 Google圖表(WEB)
# FastWeb之Google圖表
- 適用平臺:WEB(桌面)
# 1. 說明
該範例使用GoogleChart的圖表實現圖表的繪製展示。可用該圖表實現較為豐富的定義操作。
通過本範例學習,可以掌握UgFSGoogleChart的使用方法。
# 2. 設計明細
開啟FastWeb設計器,分別加入下插圖之控制元件。或者點選左上角的[匯入]選擇模板檔案來打開對應模板。
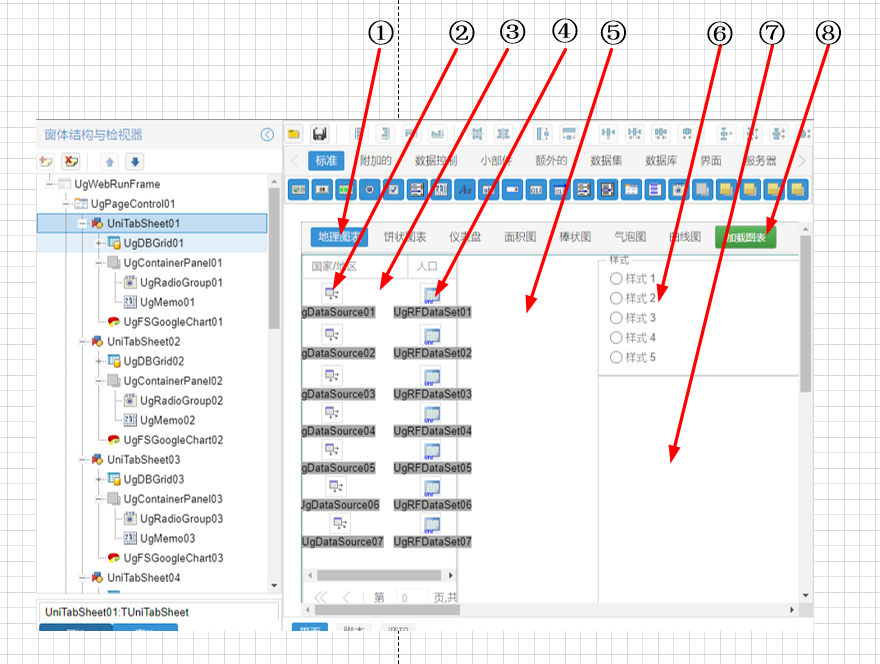
①:TUgPageControl元件,控制元件名稱為UgPageControl01。
②:TUgDataSource元件,控制元件名稱為UgDataSource01-UgDataSource07。
③:TUgDBGrid元件,控制元件名稱為UgDBGrid01-UgDBGrid07。
④:TUgRFDataSet元件,控制元件名稱為UgRFDataSet01-UgRFDataSet07。
⑤:TUgFSGoogleChart元件,控制元件名稱為UgFSGoogleChart01-UgFSGoogleChart07。
⑥:TUgRadioGroup元件,控制元件名稱為UgRadioGroup01-UgRadioGroup07。
⑦:TUgMemo元件,控制元件名稱為UgMemo01-UgMemo07。
⑧:TUgFSButton元件,控制元件名稱為UgFSButton01。
UgWebRunFrame屬性設定
Align:設定頁面的對齊方式=alClient,即使用客戶區對齊的方式。
①UgPageControl01屬性設定
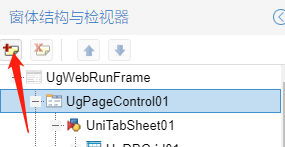
Align:設定頁面的對齊方式=alClient,即使用客戶區對齊的方式。 在窗體結構與檢視器中選擇UgPageControl01,然後點選左上角的[新增]按鈕新增Tab頁面。總計需要新增七個頁面,名稱為UniTabSheet01-UniTabSheet07。
 分別點選各個TabSheet,修改頁面標籤的標題
Caption。從左至右的各個TabSheet的Caption分別為地理圖表、餅狀圖表、儀表盤、面積圖、棒狀圖、氣泡圖、曲線圖。 分別點選各個TabSheet,分別放置一個UgDBGrid、UgFSGoogleChart、UgContainerPanel、UgRadioGroup、UgMemo、,每個TabSheet中均包含這些控制元件,編號分別一一對應。比如UniTabSheet01中放置的是UgDBGrid01、UgFSGoogleChart01、UgContainerPanel01、UgRadioGroup01、UgMemo01。其他頁面中的標籤依此放置。②UgDataSource01-UgDataSource07屬性設定
DataSet:設定對應繫結的數據集,設定為與該控制元件名稱對應序號的數據集控制元件。,比如UgDataSource01的DataSet屬性設定為UgRFDataSet01。
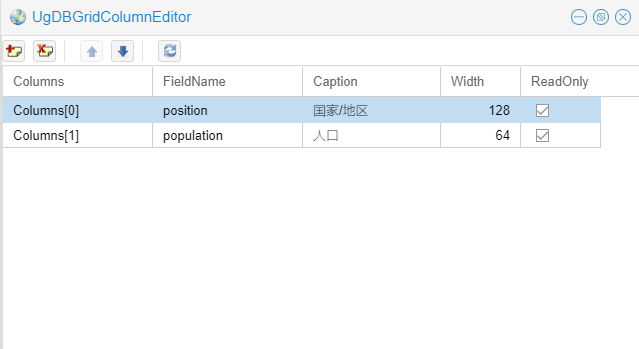
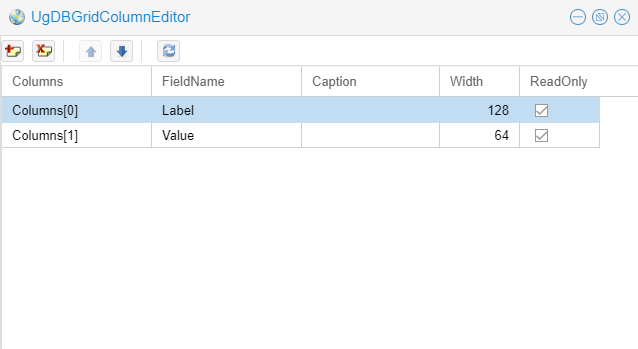
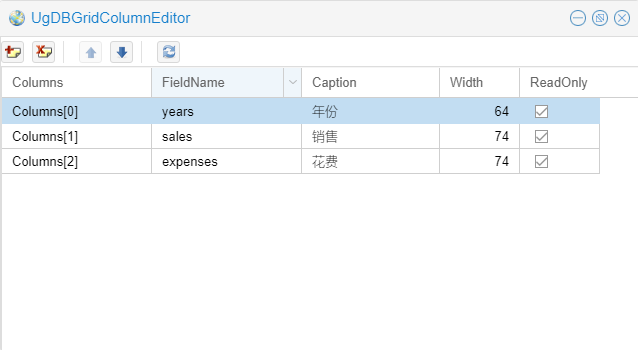
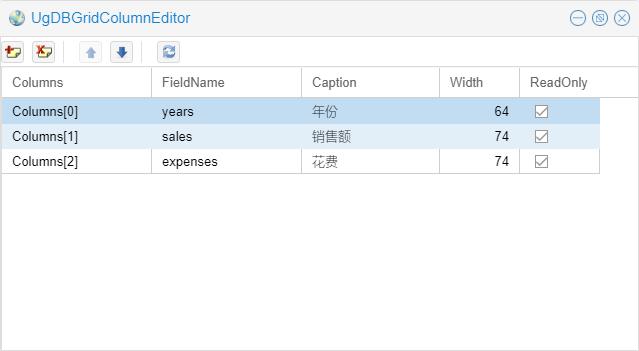
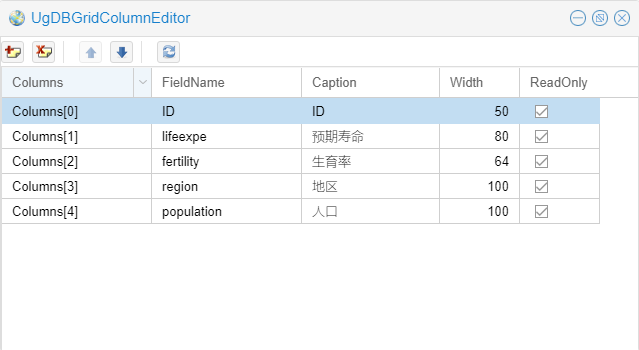
③UgDBGrid01-UgDBGrid07屬性設定 雙擊表格控制元件,打開欄位編輯界面,進行欄位編輯。
地理圖表欄位結構:
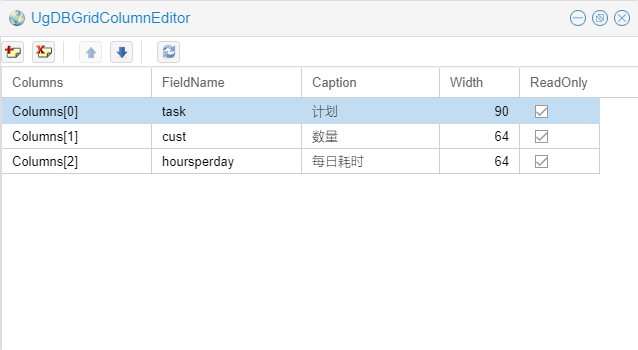
餅狀圖表欄位結構:
儀表盤欄位結構:
面積圖欄位結構:
棒狀圖欄位結構:
氣泡圖欄位結構:
曲線圖欄位結構:
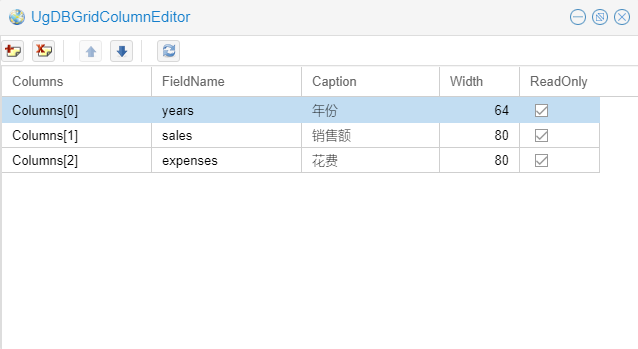
DataSource:設定繫結的數據源控制元件,此處設定序號對應的控制元件,比如UgDBGrid01的DataSource需設定為UgDataSource01。Align:設定對齊方式,設定為alLeft。
④UgRFDataSet01-UgRFDataSet07屬性設定
SQL:設定查詢的數據內容,此處需設定為自定義的內容。
UgRFDataSet01
--地理圖表數據
SELECT 'Germany' AS position, 200 AS population
UNION
SELECT 'United States' AS position, 300 AS population
UNION
SELECT 'Brazil' AS position, 400 AS population
UNION
SELECT 'Canada'  AS position, 500 AS population
UNION
SELECT 'FRANCE' AS position, 600 AS population
UNION
SELECT 'RU' AS position, 700 AS population
2
3
4
5
6
7
8
9
10
11
12
UgRFDataSet02
--餅狀圖表數據
SELECT '工作' AS task,CAST('25.20' AS Float) AS cust,11 AS hoursperday
UNION
SELECT '飲食' AS task,CAST('40' AS Float) AS cust, 2 AS hoursperday
UNION
SELECT '交流' AS task,CAST('35.60' AS Float) AS cust, 2 AS hoursperday
UNION
SELECT '看電視' AS task,CAST('10' AS Float) AS cust, 10 AS hoursperday
UNION
SELECT '睡覺' AS task,CAST('30' AS Float) AS cust, 7 AS hoursperday
2
3
4
5
6
7
8
9
10
UgRFDataSet03
--儀表盤數據
SELECT '記憶體' AS Label,80 AS Value
UNION
SELECT 'CPU' AS Label,55 AS Value
UNION
SELECT '網路' AS Label,68 AS Value
2
3
4
5
6
UgRFDataSet04
--面積圖數據
SELECT '2004' AS years,1000 AS sales,400 AS expenses
UNION
SELECT '2005' AS years,1170 AS sales,490 AS expenses
UNION
SELECT '2006' AS years,660 AS sales, 460 AS expenses
UNION
SELECT '2007' AS years,1030 AS sales, 1120 AS expenses
UNION
SELECT '2008' AS years,1080 AS sales, 1000 AS expenses
UNION
SELECT '2009' AS years,1090 AS sales, 540 AS expenses
2
3
4
5
6
7
8
9
10
11
12
UgRFDataSet05
--棒狀圖數據
SELECT '2004' AS years,1000 AS sales,400 AS expenses
UNION
SELECT '2005' AS years,1170 AS sales,490 AS expenses
UNION
SELECT '2006' AS years,660 AS sales, 460 AS expenses
UNION
SELECT '2007' AS years,1030 AS sales, 1120 AS expenses
UNION
SELECT '2008' AS years,1080 AS sales, 1000 AS expenses
UNION
SELECT '2009' AS years,1090 AS sales, 540 AS expenses
2
3
4
5
6
7
8
9
10
11
12
UgRFDataSet06
--氣泡圖數據
SELECT 'CAN' AS ID,CAST('80.66' AS float) AS lifeexpe, CAST('1.67' AS float) AS fertility, 'North America' AS region, 33739900 AS [population]
UNION
SELECT 'DEU' AS ID,CAST('79.84' AS float) AS lifeexpe, CAST('1.36' AS float) AS fertility, 'Europe' AS region, 81902307 AS [population]
UNION
SELECT 'DNK' AS ID,CAST('78.6' AS float) AS lifeexpe, CAST('1.84' AS float) AS fertility, 'Europe' AS region, 5523095 AS [population]
UNION
SELECT 'EGY' AS ID,CAST('72.73' AS float) AS lifeexpe, CAST('2.78' AS float) AS fertility, 'Middle East' AS region, 79716203 AS [population]
UNION
SELECT 'GBR' AS ID,CAST('80.05' AS float) AS lifeexpe, CAST('2' AS float) AS fertility, 'Europe' AS region, 61801570 AS [population]
UNION
SELECT 'IRN' AS ID,CAST('72.49' AS float) AS lifeexpe, CAST('1.7' AS float) AS fertility, 'Middle East' AS region, 73137148 AS [population]
UNION
SELECT 'IRQ' AS ID,CAST('68.09' AS float) AS lifeexpe, CAST('4.77' AS float) AS fertility, 'Middle East' AS region, 31090763 AS [population]
UNION
SELECT 'ISR' AS ID,CAST('81.55' AS float) AS lifeexpe, CAST('2.96' AS float) AS fertility, 'Middle East' AS region, 7485600 AS [population]
UNION
SELECT 'RUS' AS ID,CAST('68.6' AS float) AS lifeexpe, CAST('1.54' AS float) AS fertility, 'Europe' AS region, 14185000 AS [population]
UNION
SELECT 'USA' AS ID,CAST('78.09' AS float) AS lifeexpe, CAST('2.05' AS float) AS fertility, 'Middle East' AS region, 307007000 AS [population]
2
3
4
5
6
7
8
9
10
11
12
13
14
15
16
17
18
19
20
UgRFDataSet07
--曲線圖
SELECT '2004' AS years,1000 AS sales,400 AS expenses
UNION
SELECT '2005' AS years,1170 AS sales,490 AS expenses
UNION
SELECT '2006' AS years,660 AS sales, 460 AS expenses
UNION
SELECT '2007' AS years,1030 AS sales, 1120 AS expenses
UNION
SELECT '2008' AS years,1080 AS sales, 1000 AS expenses
UNION
SELECT '2009' AS years,1090 AS sales, 540 AS expenses
2
3
4
5
6
7
8
9
10
11
12
13
UgContainerPanel01-UgContainerPanel07屬性設定
Align:設定控制元件的對齊方式,設定為alRight。
⑤UgFSGoogleChart01-UgFSGoogleChart屬性設定
Align:設定對齊方式,設定為alClient。ChartDataSet:設定圖表繫結的數據集,序號需一一對應,比如UgFSGoogleChart01的ChartDataSet需設定為UgRFDataSet01。ChartType:設定圖表的型別,從控制元件名稱編號由小到大依次設定為GeoChart、PieChart、Gauge、AreaChart、Bar、BubbleChart、LineChart。
⑥UgRadioGroup01-UgRadioGroup07屬性設定
Align:設定控制元件的對齊方式,該控制元件位於UgContainerPanel中,每個控制元件對應編號放置於面板控制元件中,設定為alTop。Caption:設定選框的標題,設定為樣式。Items:設定其中的選項。點選右側的[√]打開編輯器進行編輯,根據需要新增如圖,除了UgRadioGroup02為7個樣式,其餘的均為5個樣式,以樣式X進行命名。

⑦UgMemo01-UgMemo07屬性設定
Align:設定控制元件的對齊方式,該控制元件位於UgContainerPanel中,每個控制元件對應編號放置於面板控制元件中,設定為alClIent。
⑧UgFSButton01屬性設定
Caption:設定按鈕的字幕=載入圖表。
# 3. 程式設計
點選程式設計界面右下角的按鈕,切換至單元選擇界面,勾選需要使用的單元。該程式的程式需要引用TARSLink單元。
# 3.1. 程式初始設定
設定自定義副程式,在樣式選項選擇變更后,重新設定圖表樣式。
//JScript
function OptionChange(AChart,AMemo)
//設定選項變更內容
{
  AChart.ChartOptions.Clear;
  AChart.ChartOptions.Add(AMemo.Lines.Text);
}
2
3
4
5
6
7
//PasScript
procedure OptionChange(AChart:TUgFSGoogleChart; AMemo: TUgMemo);
//設定選項變更內容
Begin
  AChart.ChartOptions.Clear;
  AChart.ChartOptions.Add(AMemo.Lines.Text);
End;
2
3
4
5
6
7
// Make sure to add code blocks to your code group
程式啟動時開啟數據集。
//JScript
{
  UgRFDataSet01.Connection = GetRFWeb;
  UgRFDataSet01.SQL.Text = "SELECT 'Germany' AS position, 200 AS population " +
	"UNION SELECT 'United States' AS position, 300 AS population " +
	"UNION SELECT 'Brazil' AS position, 400 AS population " +
	"UNION SELECT 'Canada'  AS position, 500 AS population " +
	"UNION SELECT 'FRANCE' AS position, 600 AS population " +
	"UNION SELECT 'RU' AS position, 700 AS population";
  UgRFDataSet01.Open;
  UgRFDataSet02.Connection = GetRFWeb;
  UgRFDataSet02.SQL.Text = "SELECT '" + UGMM.LT("工作") + "' AS task,CAST('25.20' AS Float) AS cust,11 AS hoursperday " +
	"UNION SELECT '" + UGMM.LT("飲食") + "' AS task,CAST('40' AS Float) AS cust, 2 AS hoursperday " +
	"UNION SELECT '" + UGMM.LT("交流") + "' AS task,CAST('35.60' AS Float) AS cust, 2 AS hoursperday " +
	"UNION SELECT '" + UGMM.LT("看電視") + "' AS task,CAST('10' AS Float) AS cust, 10 AS hoursperday " +
	"UNION SELECT '" + UGMM.LT("睡覺") + "' AS task,CAST('30' AS Float) AS cust, 7 AS hoursperday";
  UgRFDataSet02.Open;
  UgRFDataSet03.Connection = GetRFWeb;
  UgRFDataSet03.SQL.Text = "SELECT '" +UGMM.LT("記憶體") + "' AS Label,80 AS Value " +
	"UNION SELECT 'CPU' AS Label,55 AS Value " +
	"UNION SELECT '" + UGMM.LT("網路") + "' AS Label,68 AS Value";
  UgRFDataSet03.Open;
  UgRFDataSet04.Connection = GetRFWeb;
  UgRFDataSet05.SQL.Text = "SELECT '2004' AS years,1000 AS sales,400 AS expenses " +
	"UNION SELECT '2005' AS years,1170 AS sales,490 AS expenses " +
	"UNION SELECT '2006' AS years,660 AS sales, 460 AS expenses " +
	"UNION SELECT '2007' AS years,1030 AS sales, 1120 AS expenses " +
	"UNION SELECT '2008' AS years,1080 AS sales, 1000 AS expenses " +
	"UNION SELECT '2009' AS years,1090 AS sales, 540 AS expenses";
  UgRFDataSet04.Open;
  UgRFDataSet05.Connection = GetRFWeb;
  UgRFDataSet05.SQL.Text = "SELECT '2004' AS years,1000 AS sales,400 AS expenses " +
	"UNION SELECT '2005' AS years,1170 AS sales,490 AS expenses " +
	"UNION SELECT '2006' AS years,660 AS sales, 460 AS expenses " +
	"UNION SELECT '2007' AS years,1030 AS sales, 1120 AS expenses " +
	"UNION SELECT '2008' AS years,1080 AS sales, 1000 AS expenses " +
	"UNION SELECT '2009' AS years,1090 AS sales, 540 AS expenses";
  UgRFDataSet05.Open;
  UgRFDataSet06.Connection = GetRFWeb;
  UgRFDataSet06.SQL.Text = "SELECT 'CAN' AS ID,CAST('80.66' AS float) AS lifeexpe, CAST('1.67' AS float) AS fertility, 'North America' AS region, 33739900 AS [population] " +
	"UNION SELECT 'DEU' AS ID,CAST('79.84' AS float) AS lifeexpe, CAST('1.36' AS float) AS fertility, 'Europe' AS region, 81902307 AS [population] " +
	"UNION SELECT 'DNK' AS ID,CAST('78.6' AS float) AS lifeexpe, CAST('1.84' AS float) AS fertility, 'Europe' AS region, 5523095 AS [population] " +
	"UNION SELECT 'EGY' AS ID,CAST('72.73' AS float) AS lifeexpe, CAST('2.78' AS float) AS fertility, 'Middle East' AS region, 79716203 AS [population] " +
	"UNION SELECT 'GBR' AS ID,CAST('80.05' AS float) AS lifeexpe, CAST('2' AS float) AS fertility, 'Europe' AS region, 61801570 AS [population] " +
	"UNION SELECT 'IRN' AS ID,CAST('72.49' AS float) AS lifeexpe, CAST('1.7' AS float) AS fertility, 'Middle East' AS region, 73137148 AS [population] " +
	"UNION SELECT 'IRQ' AS ID,CAST('68.09' AS float) AS lifeexpe, CAST('4.77' AS float) AS fertility, 'Middle East' AS region, 31090763 AS [population] " +
	"UNION SELECT 'ISR' AS ID,CAST('81.55' AS float) AS lifeexpe, CAST('2.96' AS float) AS fertility, 'Middle East' AS region, 7485600 AS [population] " +
	"UNION SELECT 'RUS' AS ID,CAST('68.6' AS float) AS lifeexpe, CAST('1.54' AS float) AS fertility, 'Europe' AS region, 14185000 AS [population] " +
	"UNION SELECT 'USA' AS ID,CAST('78.09' AS float) AS lifeexpe, CAST('2.05' AS float) AS fertility, 'Middle East' AS region, 307007000 AS [population]";
  UgRFDataSet06.Open;
  UgRFDataSet07.Connection = GetRFWeb;
  UgRFDataSet07.SQL.Text = "SELECT '2004' AS years,1000 AS sales,400 AS expenses " +
	"UNION SELECT '2005' AS years,1170 AS sales,490 AS expenses " +
	"UNION SELECT '2006' AS years,660 AS sales, 460 AS expenses " +
	"UNION SELECT '2007' AS years,1030 AS sales, 1120 AS expenses " +
	"UNION SELECT '2008' AS years,1080 AS sales, 1000 AS expenses " +
	"UNION SELECT '2009' AS years,1090 AS sales, 540 AS expenses";
  UgRFDataSet07.Open;
}
2
3
4
5
6
7
8
9
10
11
12
13
14
15
16
17
18
19
20
21
22
23
24
25
26
27
28
29
30
31
32
33
34
35
36
37
38
39
40
41
42
43
44
45
46
47
48
49
50
51
52
53
54
55
56
57
58
59
//PasScript
Begin
  UgRFDataSet01.Connection := GetRFWeb;
  UgRFDataSet01.SQL.Text := 'SELECT ''Germany'' AS position, 200 AS population ' +
	'UNION SELECT ''United States'' AS position, 300 AS population ' +
	'UNION SELECT ''Brazil'' AS position, 400 AS population ' +
	'UNION SELECT ''Canada''  AS position, 500 AS population ' +
	'UNION SELECT ''FRANCE'' AS position, 600 AS population ' +
	'UNION SELECT ''RU'' AS position, 700 AS population';
  UgRFDataSet01.Open;
  UgRFDataSet02.Connection := GetRFWeb;
  UgRFDataSet02.SQL.Text := 'SELECT ''' + UGMM.LT('工作') + ''' AS task,CAST(''25.20'' AS Float) AS cust,11 AS hoursperday ' +
	'UNION SELECT ''' + UGMM.LT('飲食') + ''' AS task,CAST(''40'' AS Float) AS cust, 2 AS hoursperday ' +
	'UNION SELECT ''' + UGMM.LT('交流') + ''' AS task,CAST(''35.60'' AS Float) AS cust, 2 AS hoursperday ' +
	'UNION SELECT ''' + UGMM.LT('看電視') + ''' AS task,CAST(''10'' AS Float) AS cust, 10 AS hoursperday ' +
	'UNION SELECT ''' + UGMM.LT('睡覺') + ''' AS task,CAST(''30'' AS Float) AS cust, 7 AS hoursperday';
  UgRFDataSet02.Open;
  UgRFDataSet03.Connection := GetRFWeb;
  UgRFDataSet03.SQL.Text := 'SELECT ''' +UGMM.LT('記憶體') + ''' AS Label,80 AS Value ' +
	'UNION SELECT ''CPU'' AS Label,55 AS Value ' +
	'UNION SELECT ''' + UGMM.LT('網路') + ''' AS Label,68 AS Value';
  UgRFDataSet03.Open;
  UgRFDataSet04.Connection := GetRFWeb;
  UgRFDataSet05.SQL.Text := 'SELECT ''2004'' AS years,1000 AS sales,400 AS expenses ' +
	'UNION SELECT ''2005'' AS years,1170 AS sales,490 AS expenses ' +
	'UNION SELECT ''2006'' AS years,660 AS sales, 460 AS expenses ' +
	'UNION SELECT ''2007'' AS years,1030 AS sales, 1120 AS expenses ' +
	'UNION SELECT ''2008'' AS years,1080 AS sales, 1000 AS expenses ' +
	'UNION SELECT ''2009'' AS years,1090 AS sales, 540 AS expenses';
  UgRFDataSet04.Open;
  UgRFDataSet05.Connection := GetRFWeb;
  UgRFDataSet05.SQL.Text := 'SELECT ''2004'' AS years,1000 AS sales,400 AS expenses ' +
	'UNION SELECT ''2005'' AS years,1170 AS sales,490 AS expenses ' +
	'UNION SELECT ''2006'' AS years,660 AS sales, 460 AS expenses ' +
	'UNION SELECT ''2007'' AS years,1030 AS sales, 1120 AS expenses ' +
	'UNION SELECT ''2008'' AS years,1080 AS sales, 1000 AS expenses ' +
	'UNION SELECT ''2009'' AS years,1090 AS sales, 540 AS expenses';
  UgRFDataSet05.Open;
  UgRFDataSet06.Connection := GetRFWeb;
  UgRFDataSet06.SQL.Text := 'SELECT ''CAN'' AS ID,CAST(''80.66'' AS float) AS lifeexpe, CAST(''1.67'' AS float) AS fertility, ''North America'' AS region, 33739900 AS [population] ' +
	'UNION SELECT ''DEU'' AS ID,CAST(''79.84'' AS float) AS lifeexpe, CAST(''1.36'' AS float) AS fertility, ''Europe'' AS region, 81902307 AS [population] ' +
	'UNION SELECT ''DNK'' AS ID,CAST(''78.6'' AS float) AS lifeexpe, CAST(''1.84'' AS float) AS fertility, ''Europe'' AS region, 5523095 AS [population] ' +
	'UNION SELECT ''EGY'' AS ID,CAST(''72.73'' AS float) AS lifeexpe, CAST(''2.78'' AS float) AS fertility, ''Middle East'' AS region, 79716203 AS [population] ' +
	'UNION SELECT ''GBR'' AS ID,CAST(''80.05'' AS float) AS lifeexpe, CAST(''2'' AS float) AS fertility, ''Europe'' AS region, 61801570 AS [population] ' +
	'UNION SELECT ''IRN'' AS ID,CAST(''72.49'' AS float) AS lifeexpe, CAST(''1.7'' AS float) AS fertility, ''Middle East'' AS region, 73137148 AS [population] ' +
	'UNION SELECT ''IRQ'' AS ID,CAST(''68.09'' AS float) AS lifeexpe, CAST(''4.77'' AS float) AS fertility, ''Middle East'' AS region, 31090763 AS [population] ' +
	'UNION SELECT ''ISR'' AS ID,CAST(''81.55'' AS float) AS lifeexpe, CAST(''2.96'' AS float) AS fertility, ''Middle East'' AS region, 7485600 AS [population] ' +
	'UNION SELECT ''RUS'' AS ID,CAST(''68.6'' AS float) AS lifeexpe, CAST(''1.54'' AS float) AS fertility, ''Europe'' AS region, 14185000 AS [population] ' +
	'UNION SELECT ''USA'' AS ID,CAST(''78.09'' AS float) AS lifeexpe, CAST(''2.05'' AS float) AS fertility, ''Middle East'' AS region, 307007000 AS [population]';
  UgRFDataSet06.Open;
  UgRFDataSet07.Connection := GetRFWeb;
  UgRFDataSet07.SQL.Text := 'SELECT ''2004'' AS years,1000 AS sales,400 AS expenses ' +
	'UNION SELECT ''2005'' AS years,1170 AS sales,490 AS expenses ' +
	'UNION SELECT ''2006'' AS years,660 AS sales, 460 AS expenses ' +
	'UNION SELECT ''2007'' AS years,1030 AS sales, 1120 AS expenses ' +
	'UNION SELECT ''2008'' AS years,1080 AS sales, 1000 AS expenses ' +
	'UNION SELECT ''2009'' AS years,1090 AS sales, 540 AS expenses';
  UgRFDataSet07.Open;
End.
2
3
4
5
6
7
8
9
10
11
12
13
14
15
16
17
18
19
20
21
22
23
24
25
26
27
28
29
30
31
32
33
34
35
36
37
38
39
40
41
42
43
44
45
46
47
48
49
50
51
52
53
54
55
56
57
58
59
// Make sure to add code blocks to your code group
# 3.2. 事件設定
- ⑧UgFSButton01-OnClick事件
點選[載入圖表]按鈕,開啟圖表。
//JScript
function UgFSButton01OnClick(sender)
//點選載入圖片
{
  switch (UgPageControl01.TabIndex) {
  case 0: {UgFSGoogleChart01.LoadChart; }
  case 1: {UgFSGoogleChart02.LoadChart; }
  case 2: {UgFSGoogleChart03.LoadChart; }
  case 3: {UgFSGoogleChart04.LoadChart; }
  case 4: {UgFSGoogleChart05.LoadChart; }
  case 5: {UgFSGoogleChart06.LoadChart; }
  case 6: {UgFSGoogleChart07.LoadChart; }
  }
}
2
3
4
5
6
7
8
9
10
11
12
13
14
//PasScript
procedure UgFSButton01OnClick(sender: tobject);
//點選載入圖片
begin
  case UgPageControl01.TabIndex of
  0: UgFSGoogleChart01.LoadChart;
  1: UgFSGoogleChart02.LoadChart;
  2: UgFSGoogleChart03.LoadChart;
  3: UgFSGoogleChart04.LoadChart;
  4: UgFSGoogleChart05.LoadChart;
  5: UgFSGoogleChart06.LoadChart;
  6: UgFSGoogleChart07.LoadChart;
  end;
end;
2
3
4
5
6
7
8
9
10
11
12
13
14
// Make sure to add code blocks to your code group
- ⑥UgRadioGroup01-UgRadioGroup07-OnClick屬性設定
點選樣式選框中的樣式,變更圖表顯示的樣式。
//JScript
function UgRadioGroup01OnClick(sender)
//設定地形圖樣式選項
{
  switch (UgRadioGroup01.ItemIndex) {
  case 0: {UgMemo01.Lines.Text = "displayMode: \"markers\",";}
  case 1: {UgMemo01.Lines.Text = "displayMode: \"text\","; }
  case 2: {UgMemo01.Lines.Text = "displayMode: \"region\","; }
  case 3:
  {
    UgMemo01.Lines.Clear;
    UgMemo01.Lines.Add("displayMode: \"region\",");
    UgMemo01.Lines.Add("colorAxis: {colors: [\"green\", \"blue\"]}, ");
  }
  case 4:
  {
    UgMemo01.Lines.Clear;
    UgMemo01.Lines.Add("displayMode: \"region\",");
    UgMemo01.Lines.add("backgroundColor: \"#81d4fa\",");
    UgMemo01.Lines.Add("colorAxis: {colors: [\"#00853f\", \"black\", \"#e31b23\"]},");
    UgMemo01.Lines.Add("tooltip: {textStyle: {color: \"#FF0000\"}, showColorCode: true},");
  }
  }
  //ShowMessage("1");
  OptionChange(UgFSGoogleChart01,UgMemo01);
  UgFSButton01.Click;
}

function UgRadioGroup02OnClick(sender)
//設定餅圖樣式選項
{
  switch (UgRadioGroup02.ItemIndex) {
  case 0:
  {
    UgMemo02.Lines.Clear;
    UgMemo02.Lines.Add("title: \"My Daily Activities (1)\", ");
    UgMemo02.Lines.Add("tooltip: {textStyle: {color: \"#FF0000\"}, showColorCode: true},");
  }
  case 1:
  {
    UgMemo02.Lines.Clear;
    UgMemo02.Lines.Add("title: \"My Daily Activities (2)\", ");
    UgMemo02.Lines.Add("is3D: true, ");
  }
  case 2:
  {
    UgMemo02.Lines.Clear;
    UgMemo02.Lines.Add("title: \"My Daily Activities (3)\", ");
    UgMemo02.Lines.Add("pieHole: 0.4,");
  }
  case 3:
  {
    UgMemo02.Lines.Clear;
    UgMemo02.Lines.Add("title: \"My Daily Activities (4)\", ");
    UgMemo02.Lines.Add("sliceVisibilityThreshold: .2 ");
  }
  case 4:
  {
    UgMemo02.Lines.Clear;
    UgMemo02.Lines.Add("legend: \"none\",");
    UgMemo02.Lines.add("pieStartAngle: 100,");
  }
  case 5: {UgMemo02.Lines.Text = "pieSliceText: \"label\", "; }
  case 6: {UgMemo02.Lines.Text = "pieSliceText: \"value\", "; }
  }
  OptionChange(UgFSGoogleChart02,UgMemo02);
  UgFSButton01.Click;
}

function UgRadioGroup03OnClick(sender)
//設定儀表盤樣式
{
switch(UgRadioGroup03.ItemIndex) {
  case 0: {UgMemo03.Lines.Clear;}
  case 1:
  {
    UgMemo03.Lines.Clear;
    UgMemo03.Lines.Add("width: 400, height: 120, ");
    UgMemo03.Lines.Add("redFrom: 90, redTo: 100, ");
    UgMemo03.Lines.Add("yellowFrom:75, yellowTo: 90, ");
    UgMemo03.Lines.Add("minorTicks: 5, ");
  }
  case 2:
  {
    UgMemo03.Lines.Clear;
    UgMemo03.Lines.Add("redFrom: 90, redTo: 100, ");
    UgMemo03.Lines.Add("yellowFrom:75, yellowTo: 90, ");
    UgMemo03.Lines.Add("minorTicks: 5, ");
  }
  case 3:
  {
    UgMemo03.Lines.Clear;
    UgMemo03.Lines.Add("redFrom: 50, redTo: 100, ");
    UgMemo03.Lines.Add("yellowFrom:50, yellowTo: 90, ");
    UgMemo03.Lines.Add("minorTicks: 5, ");
  }
  case 4:
  {
    UgMemo03.Lines.Clear;
    UgMemo03.Lines.Add("redFrom: 90, redTo: 200, ");
    UgMemo03.Lines.add("yellowFrom:75, yellowTo: 90, ");
    UgMemo03.Lines.Add("min: 50, ");
    UgMemo03.Lines.Add("max: 200, ");
  }
  }
  OptionChange(UgFSGoogleChart03,UgMemo03);
  UgFSButton01.Click;
}

function UgRadioGroup04OnClick(sender)
//設定面積圖樣式
{
  switch(UgRadioGroup04.ItemIndex) {
  case 0:
  {
    UgMemo04.Lines.Clear;
    UgMemo04.Lines.Add("title: \"Company Performance\", ");
    UgMemo04.Lines.Add("curveType: \"none\", ");
    UgMemo04.Lines.Add("legend: { position: \"right\"}, ");
  }
  case 1:
  {
    UgMemo04.Lines.Clear;
    UgMemo04.Lines.Add("title: \"Company Performance\", ");
    UgMemo04.Lines.Add("curveType: \"function\", ");
    UgMemo04.Lines.Add("legend: { position: \"bottom\" }, ");
  }
  case 2:
  {
    UgMemo04.Lines.Clear;
    UgMemo04.Lines.Add("title: \"Company Performance\", ");
    UgMemo04.Lines.Add("curveType: \"function\", ");
    UgMemo04.Lines.Add("legend: { position: \"bottom\" }, ");
    UgMemo04.Lines.Add("orientation: \"vertical\", ");
  }
  case 3:
  {
    UgMemo04.Lines.Clear;
    UgMemo04.Lines.Add("title: \"Company Performance\", ");
    UgMemo04.Lines.Add("curveType: \"function\", ");
    UgMemo04.Lines.Add("legend: { position: \"bottom\" }, ");
    UgMemo04.Lines.Add("orientation: \"horizontal\", ");
  }
  case 4:
  {
    UgMemo04.Lines.Clear;
    UgMemo04.Lines.Add("title: \"Company Performance\", ");
    UgMemo04.Lines.add("curveType: \"none\", ");
    UgMemo04.Lines.Add("legend: { position: \"right\"}, ");
    UgMemo04.Lines.Add("selectionMode: \"multiple\", ");
  }
  }
  OptionChange(UgFSGoogleChart04,UgMemo04);
  UgFSButton01.Click;
}

function UgRadioGroup05OnClick(sender)
//設定棒狀圖樣式
{
  switch(UgRadioGroup05.ItemIndex) {
  case 0:
  {
    UgMemo05.Lines.Clear;
    UgMemo05.Lines.Add("title: \"Company Performance\", ");
    UgMemo05.Lines.Add("legend: { position: \"none\"}, ");
    UgMemo05.Lines.Add("isStacked: true, ");
  }
  case 1:
  {
    UgMemo05.Lines.Clear;
    UgMemo05.Lines.Add("title: \"Company Performance\", ");
    UgMemo05.Lines.Add("subtitle: \"Sales, Expenses, and Profit: 2014-2017\", ");
    UgMemo05.Lines.Add("legend: { position: \"bottom\", maxLines: 3 }, ");
  }
  case 2:
  {
    UgMemo05.Lines.Clear;
    UgMemo05.Lines.Add("title: \"Company Performance\", ");
    UgMemo05.Lines.Add("legend: { position: \"bottom\", maxLines: 3 }, ");
    UgMemo05.Lines.Add("orientation: \"vertical\", ");
  }
  case 3:
  {
    UgMemo05.Lines.Clear;
    UgMemo05.Lines.Add("title: \"Company Performance\", ");
    UgMemo05.Lines.Add("legend: { position: \"bottom\", maxLines: 3 }, ");
    UgMemo05.Lines.Add("orientation: \"horizontal\", ");
  }
  case 4:
  {
    UgMemo05.Lines.Clear;
    UgMemo05.Lines.Add("title: \"Company Performance\", ");
    UgMemo05.Lines.Add("legend: { position: \"right\"}, ");
    UgMemo05.Lines.Add("selectionMode: \"multiple\", ");
  }
  }
  OptionChange(UgFSGoogleChart05,UgMemo05);
  UgFSButton01.Click;
}

function UgRadioGroup06OnClick(sender)
//泡泡圖樣式
{
  switch (UgRadioGroup06.ItemIndex) {
  case 0:
  {
    UgMemo06.Lines.Clear;
    UgMemo06.Lines.Add(" hAxis: {title: \"預期壽命\"}, ");
    UgMemo06.Lines.Add(" vAxis: {title: \"生育率\"}, ");
    UgMemo06.Lines.Add("bubble: { ");
    UgMemo06.Lines.Add("  textStyle: { ");
    UgMemo06.Lines.Add("    fontSize: 12, ");
    UgMemo06.Lines.Add("    fontName: \"Times-Roman\", ");
    UgMemo06.Lines.Add("    color: \"green\", ");
    UgMemo06.Lines.Add("    bold: true, ");
    UgMemo06.Lines.Add("     italic: true ");
    UgMemo06.Lines.Add("   } ");
    UgMemo06.Lines.Add(" }, ");
  }
  case 1:
  {
    UgMemo06.Lines.Clear;
    UgMemo06.Lines.Add(" title: \"預期壽命之間的關係\", ");
    UgMemo06.Lines.Add(" hAxis: {title: \"預期壽命\"}, ");
    UgMemo06.Lines.Add(" vAxis: {title: \"生育率\"}, ");
    UgMemo06.Lines.Add(" bubble: {textStyle: {fontSize: 11}}, ");
  }
  case 2:
  {
    UgMemo06.Lines.Clear;
    UgMemo06.Lines.Add(" title: \"預期壽命之間的關係\", ");
  }
  case 3:
  {
    UgMemo06.Lines.Clear;
    UgMemo06.Lines.Add(" hAxis: {title: \"Other1\"}, ");
    UgMemo06.Lines.Add(" hAxis: {title: \"New\"}, ");
  }
  case 4:
  {
    UgMemo06.Lines.Clear;
    UgMemo06.Lines.Add("title: \"Many possibility\", ");
  }
  }
  OptionChange(UgFSGoogleChart06,UgMemo06);
  UgFSButton01.Click;
}

function UgRadioGroup07OnClick(sender)
//曲線圖樣式
{
switch(UgRadioGroup07.ItemIndex) {
  case 0:
  {
    UgMemo07.Lines.Clear;
    UgMemo07.Lines.Add("title: \"Company Performance\", ");
    UgMemo07.Lines.Add("curveType: \"none\", ");
    UgMemo07.Lines.Add("legend: { position: \"right\"}, ");
  }
  case 1:
  {
    UgMemo07.Lines.Clear;
    UgMemo07.Lines.Add("title: \"Company Performance\", ");
    UgMemo07.Lines.Add("curveType: \"function\", ");
    UgMemo07.Lines.Add("legend: { position: \"bottom\" }, ");
  }
  case 2:
  {
    UgMemo07.Lines.Clear;
    UgMemo07.Lines.Add("title: \"Company Performance\", ");
    UgMemo07.Lines.Add("curveType: \"function\", ");
    UgMemo07.Lines.Add("legend: { position: \"bottom\" }, ");
    UgMemo07.Lines.Add("orientation: \"vertical\", ");
  }
  case 3:
  {
    UgMemo07.Lines.Clear;
    UgMemo07.Lines.Add("title: \"Company Performance\", ");
    UgMemo07.Lines.Add("curveType: \"function\", ");
    UgMemo07.Lines.Add("legend: { position: \"bottom\" }, ");
    UgMemo07.Lines.Add("orientation: \"horizontal\", ");
  }
  case 4:
  {
    UgMemo07.Lines.Clear;
    UgMemo07.Lines.Add("title: \"Company Performance\", ");
    UgMemo07.Lines.add("curveType: \"none\", ");
    UgMemo07.Lines.Add("legend: { position: \"right\"}, ");
    UgMemo07.Lines.Add("selectionMode: \"multiple\", ");
  }
  }
  OptionChange(UgFSGoogleChart07,UgMemo07);
  UgFSButton01.Click;
}
2
3
4
5
6
7
8
9
10
11
12
13
14
15
16
17
18
19
20
21
22
23
24
25
26
27
28
29
30
31
32
33
34
35
36
37
38
39
40
41
42
43
44
45
46
47
48
49
50
51
52
53
54
55
56
57
58
59
60
61
62
63
64
65
66
67
68
69
70
71
72
73
74
75
76
77
78
79
80
81
82
83
84
85
86
87
88
89
90
91
92
93
94
95
96
97
98
99
100
101
102
103
104
105
106
107
108
109
110
111
112
113
114
115
116
117
118
119
120
121
122
123
124
125
126
127
128
129
130
131
132
133
134
135
136
137
138
139
140
141
142
143
144
145
146
147
148
149
150
151
152
153
154
155
156
157
158
159
160
161
162
163
164
165
166
167
168
169
170
171
172
173
174
175
176
177
178
179
180
181
182
183
184
185
186
187
188
189
190
191
192
193
194
195
196
197
198
199
200
201
202
203
204
205
206
207
208
209
210
211
212
213
214
215
216
217
218
219
220
221
222
223
224
225
226
227
228
229
230
231
232
233
234
235
236
237
238
239
240
241
242
243
244
245
246
247
248
249
250
251
252
253
254
255
256
257
258
259
260
261
262
263
264
265
266
267
268
269
270
271
272
273
274
275
276
277
278
279
280
281
282
283
284
285
286
287
288
289
290
291
292
293
294
//PasScript
procedure UgRadioGroup01OnClick(sender: tobject);
//設定地形圖樣式選項
begin
  case UgRadioGroup01.ItemIndex of
  0: UgMemo01.Lines.Text := 'displayMode: "markers",';
  1: UgMemo01.Lines.Text := 'displayMode: "text",';
  2: UgMemo01.Lines.Text := 'displayMode: "region",';
  3:
  Begin
    UgMemo01.Lines.Clear;
    UgMemo01.Lines.Add('displayMode: "region",');
    UgMemo01.Lines.Add('colorAxis: {colors: ["green", "blue"]}, ');
  end;
  4:
  Begin
    UgMemo01.Lines.Clear;
    UgMemo01.Lines.Add('displayMode: "region",');
    UgMemo01.Lines.add('backgroundColor: "#81d4fa",');
    UgMemo01.Lines.Add('colorAxis: {colors: ["#00853f", "black", "#e31b23"]},');
    UgMemo01.Lines.Add('tooltip: {textStyle: {color: "#FF0000"}, showColorCode: true},');
  End;
  End;
  OptionChange(UgFSGoogleChart01,UgMemo01);
  UgFSButton01.Click;
end;

procedure UgRadioGroup02OnClick(sender: tobject);
//設定餅圖樣式選項
begin
  case UgRadioGroup02.ItemIndex of
  0:
  begin
    UgMemo02.Lines.Clear;
    UgMemo02.Lines.Add('title: "My Daily Activities (1)", ');
    UgMemo02.Lines.Add('tooltip: {textStyle: {color: "#FF0000"}, showColorCode: true},');
  end;
  1:
  begin
    UgMemo02.Lines.Clear;
    UgMemo02.Lines.Add('title: "My Daily Activities (2)", ');
    UgMemo02.Lines.Add('is3D: true, ');
  end;
  2:
  Begin
    UgMemo02.Lines.Clear;
    UgMemo02.Lines.Add('title: "My Daily Activities (3)", ');
    UgMemo02.Lines.Add('pieHole: 0.4,');
  end;
  3:
  Begin
    UgMemo02.Lines.Clear;
    UgMemo02.Lines.Add('title: "My Daily Activities (4)", ');
    UgMemo02.Lines.Add('sliceVisibilityThreshold: .2 ');
  end;
  4:
  Begin
    UgMemo02.Lines.Clear;
    UgMemo02.Lines.Add('legend: "none",');
    UgMemo02.Lines.add('pieStartAngle: 100,');
  End;
  5: UgMemo02.Lines.Text := 'pieSliceText: "label", ';
  6: UgMemo02.Lines.Text := 'pieSliceText: "value", ';
  End;
  OptionChange(UgFSGoogleChart02,UgMemo02);
  UgFSButton01.Click;
end;

procedure UgRadioGroup03OnClick(sender: tobject);
//設定儀表盤樣式
begin
  case UgRadioGroup03.ItemIndex of
  0:
  begin
    UgMemo03.Lines.Clear;
  end;
  1:
  begin
    UgMemo03.Lines.Clear;
    UgMemo03.Lines.Add('width: 400, height: 120, ');
    UgMemo03.Lines.Add('redFrom: 90, redTo: 100, ');
    UgMemo03.Lines.Add('yellowFrom:75, yellowTo: 90, ');
    UgMemo03.Lines.Add('minorTicks: 5, ');
  end;
  2:
  Begin
    UgMemo03.Lines.Clear;
    UgMemo03.Lines.Add('redFrom: 90, redTo: 100, ');
    UgMemo03.Lines.Add('yellowFrom:75, yellowTo: 90, ');
    UgMemo03.Lines.Add('minorTicks: 5, ');
  end;
  3:
  Begin
    UgMemo03.Lines.Clear;
    UgMemo03.Lines.Add('redFrom: 50, redTo: 100, ');
    UgMemo03.Lines.Add('yellowFrom:50, yellowTo: 90, ');
    UgMemo03.Lines.Add('minorTicks: 5, ');
  end;
  4:
  Begin
    UgMemo03.Lines.Clear;
    UgMemo03.Lines.Add('redFrom: 90, redTo: 200, ');
    UgMemo03.Lines.add('yellowFrom:75, yellowTo: 90, ');
    UgMemo03.Lines.Add('min: 50, ');
    UgMemo03.Lines.Add('max: 200, ');
  End;
  End;
  OptionChange(UgFSGoogleChart03,UgMemo03);
  UgFSButton01.Click;
end;

procedure UgRadioGroup04OnClick(sender: tobject);
//設定面積圖樣式
begin
  case UgRadioGroup04.ItemIndex of
  0:
  begin
    UgMemo04.Lines.Clear;
    UgMemo04.Lines.Add('title: "Company Performance", ');
    UgMemo04.Lines.Add('curveType: "none", ');
    UgMemo04.Lines.Add('legend: { position: "right"}, ');
  end;
  1:
  begin
    UgMemo04.Lines.Clear;
    UgMemo04.Lines.Add('title: "Company Performance", ');
    UgMemo04.Lines.Add('curveType: "function", ');
    UgMemo04.Lines.Add('legend: { position: "bottom" }, ');
  end;
  2:
  Begin
    UgMemo04.Lines.Clear;
    UgMemo04.Lines.Add('title: "Company Performance", ');
    UgMemo04.Lines.Add('curveType: "function", ');
    UgMemo04.Lines.Add('legend: { position: "bottom" }, ');
    UgMemo04.Lines.Add('orientation: "vertical", ');
  end;
  3:
  Begin
    UgMemo04.Lines.Clear;
    UgMemo04.Lines.Add('title: "Company Performance", ');
    UgMemo04.Lines.Add('curveType: "function", ');
    UgMemo04.Lines.Add('legend: { position: "bottom" }, ');
    UgMemo04.Lines.Add('orientation: "horizontal", ');
  end;
  4:
  Begin
    UgMemo04.Lines.Clear;
    UgMemo04.Lines.Add('title: "Company Performance", ');
    UgMemo04.Lines.add('curveType: "none", ');
    UgMemo04.Lines.Add('legend: { position: "right"}, ');
    UgMemo04.Lines.Add('selectionMode: "multiple", ');
  End;
  End;
  OptionChange(UgFSGoogleChart04,UgMemo04);
  UgFSButton01.Click;
end;

procedure UgRadioGroup05OnClick(sender: tobject);
//設定棒狀圖樣式
begin
  case UgRadioGroup05.ItemIndex of
  0:
  begin
    UgMemo05.Lines.Clear;
    UgMemo05.Lines.Add('title: "Company Performance", ');
    UgMemo05.Lines.Add('legend: { position: "none"}, ');
    UgMemo05.Lines.Add('isStacked: true, ');
  end;
  1:
  begin
    UgMemo05.Lines.Clear;
    UgMemo05.Lines.Add('title: "Company Performance", ');
    UgMemo05.Lines.Add('subtitle: "Sales, Expenses, and Profit: 2014-2017", ');
    UgMemo05.Lines.Add('legend: { position: "bottom", maxLines: 3 }, ');
  end;
  2:
  Begin
    UgMemo05.Lines.Clear;
    UgMemo05.Lines.Add('title: "Company Performance", ');
    UgMemo05.Lines.Add('legend: { position: "bottom", maxLines: 3 }, ');
    UgMemo05.Lines.Add('orientation: "vertical", ');
  end;
  3:
  Begin
    UgMemo05.Lines.Clear;
    UgMemo05.Lines.Add('title: "Company Performance", ');
    UgMemo05.Lines.Add('legend: { position: "bottom", maxLines: 3 }, ');
    UgMemo05.Lines.Add('orientation: "horizontal", ');
  end;
  4:
  Begin
    UgMemo05.Lines.Clear;
    UgMemo05.Lines.Add('title: "Company Performance", ');
    UgMemo05.Lines.Add('legend: { position: "right"}, ');
    UgMemo05.Lines.Add('selectionMode: "multiple", ');
  End;
  End;
  OptionChange(UgFSGoogleChart05,UgMemo05);
  UgFSButton01.Click;
end;

procedure UgRadioGroup06OnClick(sender: tobject);
//泡泡圖樣式
begin
  case UgRadioGroup06.ItemIndex of
  0:
  begin
    UgMemo06.Lines.Clear;
    UgMemo06.Lines.Add(' hAxis: {title: "預期壽命"}, ');
    UgMemo06.Lines.Add(' vAxis: {title: "生育率"}, ');
    UgMemo06.Lines.Add('bubble: { ');
    UgMemo06.Lines.Add('  textStyle: { ');
    UgMemo06.Lines.Add('    fontSize: 12, ');
    UgMemo06.Lines.Add('    fontName: "Times-Roman", ');
    UgMemo06.Lines.Add('    color: "green", ');
    UgMemo06.Lines.Add('    bold: true, ');
    UgMemo06.Lines.Add('     italic: true ');
    UgMemo06.Lines.Add('   } ');
    UgMemo06.Lines.Add(' }, ');
  end;
  1:
  begin
    UgMemo06.Lines.Clear;
    UgMemo06.Lines.Add(' title: "預期壽命之間的關係", ');
    UgMemo06.Lines.Add(' hAxis: {title: "預期壽命"}, ');
    UgMemo06.Lines.Add(' vAxis: {title: "生育率"}, ');
    UgMemo06.Lines.Add(' bubble: {textStyle: {fontSize: 11}}, ');
  end;
  2:
  Begin
    UgMemo06.Lines.Clear;
    UgMemo06.Lines.Add(' title: "預期壽命之間的關係", ');
  end;
  3:
  Begin
    UgMemo06.Lines.Clear;
    UgMemo06.Lines.Add(' hAxis: {title: "Other1"}, ');
    UgMemo06.Lines.Add(' hAxis: {title: "New"}, ');
  end;
  4:
  Begin
    UgMemo06.Lines.Clear;
    UgMemo06.Lines.Add('title: "Many possibility", ');
  End;
  End;
  OptionChange(UgFSGoogleChart06,UgMemo06);
  UgFSButton01.Click;
end;

procedure UgRadioGroup07OnClick(sender: tobject);
//曲線圖樣式
begin
  case UgRadioGroup07.ItemIndex of
  0:
  begin
    UgMemo07.Lines.Clear;
    UgMemo07.Lines.Add('title: "Company Performance", ');
    UgMemo07.Lines.Add('curveType: "none", ');
    UgMemo07.Lines.Add('legend: { position: "right"}, ');
  end;
  1:
  begin
    UgMemo07.Lines.Clear;
    UgMemo07.Lines.Add('title: "Company Performance", ');
    UgMemo07.Lines.Add('curveType: "function", ');
    UgMemo07.Lines.Add('legend: { position: "bottom" }, ');
  end;
  2:
  Begin
    UgMemo07.Lines.Clear;
    UgMemo07.Lines.Add('title: "Company Performance", ');
    UgMemo07.Lines.Add('curveType: "function", ');
    UgMemo07.Lines.Add('legend: { position: "bottom" }, ');
    UgMemo07.Lines.Add('orientation: "vertical", ');
  end;
  3:
  Begin
    UgMemo07.Lines.Clear;
    UgMemo07.Lines.Add('title: "Company Performance", ');
    UgMemo07.Lines.Add('curveType: "function", ');
    UgMemo07.Lines.Add('legend: { position: "bottom" }, ');
    UgMemo07.Lines.Add('orientation: "horizontal", ');
  end;
  4:
  Begin
    UgMemo07.Lines.Clear;
    UgMemo07.Lines.Add('title: "Company Performance", ');
    UgMemo07.Lines.add('curveType: "none", ');
    UgMemo07.Lines.Add('legend: { position: "right"}, ');
    UgMemo07.Lines.Add('selectionMode: "multiple", ');
  End;
  End;
  OptionChange(UgFSGoogleChart07,UgMemo07);
  UgFSButton01.Click;
end;
2
3
4
5
6
7
8
9
10
11
12
13
14
15
16
17
18
19
20
21
22
23
24
25
26
27
28
29
30
31
32
33
34
35
36
37
38
39
40
41
42
43
44
45
46
47
48
49
50
51
52
53
54
55
56
57
58
59
60
61
62
63
64
65
66
67
68
69
70
71
72
73
74
75
76
77
78
79
80
81
82
83
84
85
86
87
88
89
90
91
92
93
94
95
96
97
98
99
100
101
102
103
104
105
106
107
108
109
110
111
112
113
114
115
116
117
118
119
120
121
122
123
124
125
126
127
128
129
130
131
132
133
134
135
136
137
138
139
140
141
142
143
144
145
146
147
148
149
150
151
152
153
154
155
156
157
158
159
160
161
162
163
164
165
166
167
168
169
170
171
172
173
174
175
176
177
178
179
180
181
182
183
184
185
186
187
188
189
190
191
192
193
194
195
196
197
198
199
200
201
202
203
204
205
206
207
208
209
210
211
212
213
214
215
216
217
218
219
220
221
222
223
224
225
226
227
228
229
230
231
232
233
234
235
236
237
238
239
240
241
242
243
244
245
246
247
248
249
250
251
252
253
254
255
256
257
258
259
260
261
262
263
264
265
266
267
268
269
270
271
272
273
274
275
276
277
278
279
280
281
282
283
284
285
286
287
288
289
290
291
292
293
294
295
296
// Make sure to add code blocks to your code group
# 4. 運行結果
使用滑鼠在FastWeb功能表,點選[儲存至資料庫]按鈕,將其儲存至資料庫,點選[除錯運行]確認能夠正常打開。
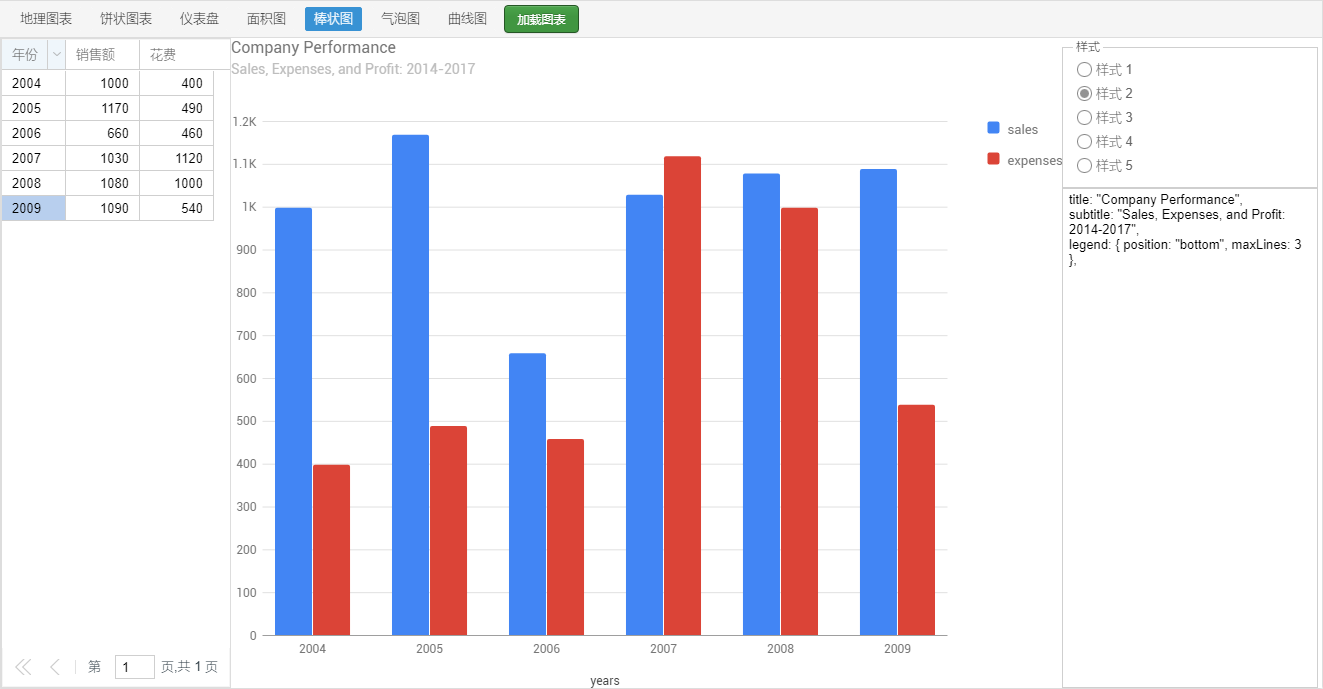
點選頁面區域可切換顯示的圖表型別,點選[載入圖表]按鈕載入對應頁面的圖表。點選右側的樣式選框可選擇對應的樣式進行圖表的載入。