
 在圖表中加入互動元件
# 11. 在圖表中加入互動元件
除了圖表外,ECharts中提供了很多互動元件。例如:
圖例元件 legend、標題元件 title、視覺對映元件 visualMap、數據區域縮放元件 dataZoom、時間線元件 timeline
下面以 數據區域縮放元件 dataZoom 為例,介紹如何加入這種元件。
# 11.1. 數據區域縮放元件(dataZoom)介紹
『概覽數據整體,按需關注數據細節』是數據視覺化的基本互動需求。dataZoom 元件能夠在直角座標系(grid)、極座標系(polar)中實現這一功能。
如下例子:
- FastWeb TUgURLFrame示例:
如需在FastWeb中的TUgURLFrame中實現上述效果,則修改其HTML屬性,使用下列內容:
<!DOCTYPE html>
<html>
<head>
    <meta charset="utf-8">
    <title>ECharts</title>
    <!-- 引入 echarts.js -->
    <script src="https://cdn.staticfile.org/echarts/5.1.2/echarts.min.js"></script>
</head>
<body>
    <!-- 為ECharts準備一個具備大小(寬高)的Dom -->
    <div id="main" style="width: 600px;height:400px;"></div>
    <script type="text/javascript">
        // 基於準備好的dom,初始化echarts實體
        var myChart = echarts.init(document.getElementById('main'));
        var option;

        var data1 = [];
        var data2 = [];
        var data3 = [];

        var random = function (max) {
            return (Math.random() * max).toFixed(3);
        };

        for (var i = 0; i < 500; i++) {
            data1.push([random(15), random(10), random(1)]);
            data2.push([random(10), random(10), random(1)]);
            data3.push([random(15), random(10), random(1)]);
        }

        option = {
            animation: false,
            legend: {
                data: ['scatter', 'scatter2', 'scatter3']
            },
            tooltip: {
            },
            xAxis: {
                type: 'value',
                min: 'dataMin',
                max: 'dataMax',
                splitLine: {
                    show: true
                }
            },
            yAxis: {
                type: 'value',
                min: 'dataMin',
                max: 'dataMax',
                splitLine: {
                    show: true
                }
            },
            dataZoom: [
                {
                    type: 'slider',
                    show: true,
                    xAxisIndex: [0],
                    start: 1,
                    end: 35
                },
                {
                    type: 'slider',
                    show: true,
                    yAxisIndex: [0],
                    left: '93%',
                    start: 29,
                    end: 36
                },
                {
                    type: 'inside',
                    xAxisIndex: [0],
                    start: 1,
                    end: 35
                },
                {
                    type: 'inside',
                    yAxisIndex: [0],
                    start: 29,
                    end: 36
                }
            ],
            series: [
                {
                    name: 'scatter',
                    type: 'scatter',
                    itemStyle: {
                        normal: {
                            opacity: 0.8
                        }
                    },
                    symbolSize: function (val) {
                        return val[2] * 40;
                    },
                    data: data1
                },
                {
                    name: 'scatter2',
                    type: 'scatter',
                    itemStyle: {
                        normal: {
                            opacity: 0.8
                        }
                    },
                    symbolSize: function (val) {
                        return val[2] * 40;
                    },
                    data: data2
                },
                {
                    name: 'scatter3',
                    type: 'scatter',
                    itemStyle: {
                        normal: {
                            opacity: 0.8,
                        }
                    },
                    symbolSize: function (val) {
                        return val[2] * 40;
                    },
                    data: data3
                }
            ]
        }

        // 使用剛指定的配置項和數據顯示圖表。
        myChart.setOption(option);
    </script>
</body>
</html>
2
3
4
5
6
7
8
9
10
11
12
13
14
15
16
17
18
19
20
21
22
23
24
25
26
27
28
29
30
31
32
33
34
35
36
37
38
39
40
41
42
43
44
45
46
47
48
49
50
51
52
53
54
55
56
57
58
59
60
61
62
63
64
65
66
67
68
69
70
71
72
73
74
75
76
77
78
79
80
81
82
83
84
85
86
87
88
89
90
91
92
93
94
95
96
97
98
99
100
101
102
103
104
105
106
107
108
109
110
111
112
113
114
115
116
117
118
119
120
121
122
123
124
125
126
127
128
129
130
dataZoom元件是對數軸(axis)進行『數據視窗縮放』『數據視窗平移』操作。
可以通過 dataZoom.xAxisIndex 或 dataZoom.yAxisIndex 來指定
dataZoom控制哪個或哪些數軸。
dataZoom元件可同時存在多個,起到共同控制的作用。控制同一個數軸的元件,會自動聯動。下面例子中會詳細說明。dataZoom的運行原理是通過『數據過濾』來達到『數據視窗縮放』的效果。數據過濾模式的設定不同,效果也不同,參見:dataZoom.filterMode。
dataZoom的數據視窗範圍的設定,目前支援兩種形式:百分比形式:參見 dataZoom.start 和 dataZoom.end。
絕對數值形式:參見 dataZoom.startValue 和 dataZoom.endValue。
dataZoom 元件現在支援幾種子元件:
內建型數據區域縮放元件(dataZoomInside):內建于座標系中。
滑動條型數據區域縮放元件(dataZoomSlider):有單獨的滑動條操作。
框選型數據區域縮放元件(dataZoomSelect):全屏的選框進行數據區域縮放。入口和配置項均在
toolbox中。
# 11.2. 在程式碼加入 dataZoom 元件
先只對單獨一個橫軸,加上 dataZoom 元件,程式碼示例如下:
option = {
    xAxis: {
        type: 'value'
    },
    yAxis: {
        type: 'value'
    },
    dataZoom: [
        {   // 這個dataZoom元件,預設控制x軸。
            type: 'slider', // 這個 dataZoom 元件是 slider 型 dataZoom 元件
            start: 10,      // 左邊在 10% 的位置。
            end: 60         // 右邊在 60% 的位置。
        }
    ],
    series: [
        {
            type: 'scatter', // 這是個『散點圖』
            itemStyle: {
                opacity: 0.8
            },
            symbolSize: function (val) {
                return val[2] * 40;
            },
            data: [["14.616","7.241","0.896"],["3.958","5.701","0.955"],["2.768","8.971","0.669"],["9.051","9.710","0.171"],["14.046","4.182","0.536"],["12.295","1.429","0.962"],["4.417","8.167","0.113"],["0.492","4.771","0.785"],["7.632","2.605","0.645"],["14.242","5.042","0.368"]]
        }
    ]
}
2
3
4
5
6
7
8
9
10
11
12
13
14
15
16
17
18
19
20
21
22
23
24
25
26
27
28
可以看到如下結果:
- FastWeb TUgEChart示例:
如需在FastWeb中的TUgEChart中實現上述效果,則修改其Options屬性,使用下列配置:
option = {
    xAxis: {
        type: 'value'
    },
    yAxis: {
        type: 'value'
    },
    dataZoom: [
        {
            type: 'slider',
            start: 1,
            end: 35
        }
    ],
    series: [
        {
            name: 'scatter',
            type: 'scatter',
            itemStyle: {
                normal: {
                    opacity: 0.8
                }
            },
            symbolSize: function (val) {
                return val[2] * 40;
            },
            data: [["14.616","7.241","0.896"],["3.958","5.701","0.955"],["2.768","8.971","0.669"],["9.051","9.710","0.171"],["14.046","4.182","0.536"],["12.295","1.429","0.962"],["4.417","8.167","0.113"],["0.492","4.771","0.785"],["7.632","2.605","0.645"],["14.242","5.042","0.368"]]
        }
    ]
}
2
3
4
5
6
7
8
9
10
11
12
13
14
15
16
17
18
19
20
21
22
23
24
25
26
27
28
29
30
- FastWeb TUgURLFrame示例:
如需在FastWeb中的TUgURLFrame中實現上述效果,則修改其HTML屬性,使用下列內容:
<!DOCTYPE html>
<html>
<head>
    <meta charset="utf-8">
    <title>ECharts</title>
    <!-- 引入 echarts.js -->
    <script src="https://cdn.staticfile.org/echarts/5.1.2/echarts.min.js"></script>
</head>
<body>
    <!-- 為ECharts準備一個具備大小(寬高)的Dom -->
    <div id="main" style="width: 600px;height:400px;"></div>
    <script type="text/javascript">
        // 基於準備好的dom,初始化echarts實體
        var myChart = echarts.init(document.getElementById('main'));
        var option;

        option = {
            xAxis: {
                type: 'value'
            },
            yAxis: {
                type: 'value'
            },
            dataZoom: [
                {
                    type: 'slider',
                    start: 1,
                    end: 35
                }
            ],
            series: [
                {
                    name: 'scatter',
                    type: 'scatter',
                    itemStyle: {
                        normal: {
                            opacity: 0.8
                        }
                    },
                    symbolSize: function (val) {
                        return val[2] * 40;
                    },
                    data: [["14.616","7.241","0.896"],["3.958","5.701","0.955"],["2.768","8.971","0.669"],["9.051","9.710","0.171"],["14.046","4.182","0.536"],["12.295","1.429","0.962"],["4.417","8.167","0.113"],["0.492","4.771","0.785"],["7.632","2.605","0.645"],["14.242","5.042","0.368"]]
                }
            ]
        }

        // 使用剛指定的配置項和數據顯示圖表。
        myChart.setOption(option);
    </script>
</body>
</html>
2
3
4
5
6
7
8
9
10
11
12
13
14
15
16
17
18
19
20
21
22
23
24
25
26
27
28
29
30
31
32
33
34
35
36
37
38
39
40
41
42
43
44
45
46
47
48
49
50
51
52
上面的圖只能拖動 dataZoom 元件導致視窗變化。如果想在座標系內進行拖動,以及用滾輪(或移動觸屏上的兩指滑動)進行縮放,那麼要再加上一個 inside 型的 dataZoom元件。直接在上面的 option.dataZoom 中增加即可:
option = {
    ...,
    dataZoom: [
        {   // 這個dataZoom元件,預設控制x軸。
            type: 'slider', // 這個 dataZoom 元件是 slider 型 dataZoom 元件
            start: 10,      // 左邊在 10% 的位置。
            end: 60         // 右邊在 60% 的位置。
        },
        {   // 這個dataZoom元件,也控制x軸。
            type: 'inside', // 這個 dataZoom 元件是 inside 型 dataZoom 元件
            start: 10,      // 左邊在 10% 的位置。
            end: 60         // 右邊在 60% 的位置。
        }
    ],
    ...
}
2
3
4
5
6
7
8
9
10
11
12
13
14
15
16
- FastWeb TUgEChart示例:
如需在FastWeb中的TUgEChart中實現上述效果,則修改其Options屬性,使用下列配置:
option = {
    xAxis: {
        type: 'value'
    },
    yAxis: {
        type: 'value'
    },
    dataZoom: [
        {
            type: 'slider',
            start: 1,
            end: 35
        },
        {
            type: 'inside',
            start: 1,
            end: 35
        }
    ],
    series: [
        {
            name: 'scatter',
            type: 'scatter',
            itemStyle: {
                normal: {
                    opacity: 0.8
                }
            },
            symbolSize: function (val) {
                return val[2] * 40;
            },
            data: [["14.616","7.241","0.896"],["3.958","5.701","0.955"],["2.768","8.971","0.669"],["9.051","9.710","0.171"],["14.046","4.182","0.536"],["12.295","1.429","0.962"],["4.417","8.167","0.113"],["0.492","4.771","0.785"],["7.632","2.605","0.645"],["14.242","5.042","0.368"]]
        }
    ]
}
2
3
4
5
6
7
8
9
10
11
12
13
14
15
16
17
18
19
20
21
22
23
24
25
26
27
28
29
30
31
32
33
34
35
- FastWeb TUgURLFrame示例:
如需在FastWeb中的TUgURLFrame中實現上述效果,則修改其HTML屬性,使用下列內容:
<!DOCTYPE html>
<html>
<head>
    <meta charset="utf-8">
    <title>ECharts</title>
    <!-- 引入 echarts.js -->
    <script src="https://cdn.staticfile.org/echarts/5.1.2/echarts.min.js"></script>
</head>
<body>
    <!-- 為ECharts準備一個具備大小(寬高)的Dom -->
    <div id="main" style="width: 600px;height:400px;"></div>
    <script type="text/javascript">
        // 基於準備好的dom,初始化echarts實體
        var myChart = echarts.init(document.getElementById('main'));
        var option;

        option = {
            xAxis: {
                type: 'value'
            },
            yAxis: {
                type: 'value'
            },
            dataZoom: [
                {
                    type: 'slider',
                    start: 1,
                    end: 35
                },
                {
                    type: 'inside',
                    start: 1,
                    end: 35
                }
            ],
            series: [
                {
                    name: 'scatter',
                    type: 'scatter',
                    itemStyle: {
                        normal: {
                            opacity: 0.8
                        }
                    },
                    symbolSize: function (val) {
                        return val[2] * 40;
                    },
                    data: [["14.616","7.241","0.896"],["3.958","5.701","0.955"],["2.768","8.971","0.669"],["9.051","9.710","0.171"],["14.046","4.182","0.536"],["12.295","1.429","0.962"],["4.417","8.167","0.113"],["0.492","4.771","0.785"],["7.632","2.605","0.645"],["14.242","5.042","0.368"]]
                }
            ]
        }

        // 使用剛指定的配置項和數據顯示圖表。
        myChart.setOption(option);
    </script>
</body>
</html>
2
3
4
5
6
7
8
9
10
11
12
13
14
15
16
17
18
19
20
21
22
23
24
25
26
27
28
29
30
31
32
33
34
35
36
37
38
39
40
41
42
43
44
45
46
47
48
49
50
51
52
53
54
55
56
57
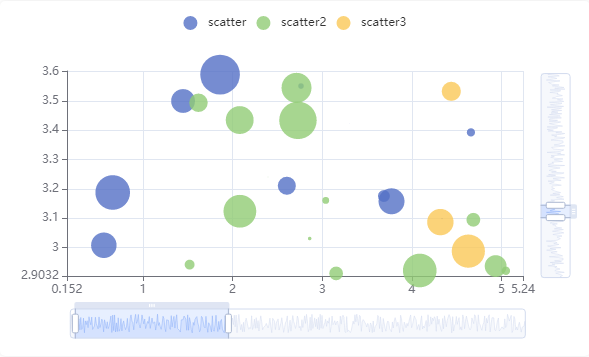
可以看到如下結果(能在座標系中進行滑動,以及使用滾輪縮放了):

如果想 y 軸也能夠縮放,那麼在 y 軸上也加上 dataZoom 元件:
option = {
    ...,
    dataZoom: [
        {
            type: 'slider',
            xAxisIndex: 0,
            start: 10,
            end: 60
        },
        {
            type: 'inside',
            xAxisIndex: 0,
            start: 10,
            end: 60
        },
        {
            type: 'slider',
            yAxisIndex: 0,
            start: 30,
            end: 80
        },
        {
            type: 'inside',
            yAxisIndex: 0,
            start: 30,
            end: 80
        }
    ],
    ...
}
2
3
4
5
6
7
8
9
10
11
12
13
14
15
16
17
18
19
20
21
22
23
24
25
26
27
28
29
30
- FastWeb TUgEChart示例:
如需在FastWeb中的TUgEChart中實現上述效果,則修改其Options屬性,使用下列配置:
option = {
    xAxis: {
        type: 'value'
    },
    yAxis: {
        type: 'value'
    },
    dataZoom: [
        {
            type: 'slider',
            xAxisIndex: 0,
            start: 10,
            end: 60
        },
        {
            type: 'inside',
            xAxisIndex: 0,
            start: 10,
            end: 60
        },
        {
            type: 'slider',
            yAxisIndex: 0,
            start: 30,
            end: 80
        },
        {
            type: 'inside',
            yAxisIndex: 0,
            start: 30,
            end: 80
        }
    ],
    series: [
        {
            name: 'scatter',
            type: 'scatter',
            itemStyle: {
                normal: {
                    opacity: 0.8
                }
            },
            symbolSize: function (val) {
                return val[2] * 40;
            },
            data: [["14.616","7.241","0.896"],["3.958","5.701","0.955"],["2.768","8.971","0.669"],["9.051","9.710","0.171"],["14.046","4.182","0.536"],["12.295","1.429","0.962"],["4.417","8.167","0.113"],["0.492","4.771","0.785"],["7.632","2.605","0.645"],["14.242","5.042","0.368"]]
        }
    ]
}
2
3
4
5
6
7
8
9
10
11
12
13
14
15
16
17
18
19
20
21
22
23
24
25
26
27
28
29
30
31
32
33
34
35
36
37
38
39
40
41
42
43
44
45
46
47
48
49
- FastWeb TUgURLFrame示例:
如需在FastWeb中的TUgURLFrame中實現上述效果,則修改其HTML屬性,使用下列內容:
<!DOCTYPE html>
<html>
<head>
    <meta charset="utf-8">
    <title>ECharts</title>
    <!-- 引入 echarts.js -->
    <script src="https://cdn.staticfile.org/echarts/5.1.2/echarts.min.js"></script>
</head>
<body>
    <!-- 為ECharts準備一個具備大小(寬高)的Dom -->
    <div id="main" style="width: 600px;height:400px;"></div>
    <script type="text/javascript">
        // 基於準備好的dom,初始化echarts實體
        var myChart = echarts.init(document.getElementById('main'));
        var option;

        option = {
            xAxis: {
                type: 'value'
            },
            yAxis: {
                type: 'value'
            },
            dataZoom: [
                {
                    type: 'slider',
                    xAxisIndex: 0,
                    start: 10,
                    end: 60
                },
                {
                    type: 'inside',
                    xAxisIndex: 0,
                    start: 10,
                    end: 60
                },
                {
                    type: 'slider',
                    yAxisIndex: 0,
                    start: 30,
                    end: 80
                },
                {
                    type: 'inside',
                    yAxisIndex: 0,
                    start: 30,
                    end: 80
                }
            ],
            series: [
                {
                    name: 'scatter',
                    type: 'scatter',
                    itemStyle: {
                        normal: {
                            opacity: 0.8
                        }
                    },
                    symbolSize: function (val) {
                        return val[2] * 40;
                    },
                    data: [["14.616","7.241","0.896"],["3.958","5.701","0.955"],["2.768","8.971","0.669"],["9.051","9.710","0.171"],["14.046","4.182","0.536"],["12.295","1.429","0.962"],["4.417","8.167","0.113"],["0.492","4.771","0.785"],["7.632","2.605","0.645"],["14.242","5.042","0.368"]]
                }
            ]
        }

        // 使用剛指定的配置項和數據顯示圖表。
        myChart.setOption(option);
    </script>
</body>
</html>
2
3
4
5
6
7
8
9
10
11
12
13
14
15
16
17
18
19
20
21
22
23
24
25
26
27
28
29
30
31
32
33
34
35
36
37
38
39
40
41
42
43
44
45
46
47
48
49
50
51
52
53
54
55
56
57
58
59
60
61
62
63
64
65
66
67
68
69
70
71
可以看到如下結果:
